
The disconnect is real — and it's measurable. A Makino study cited by Cutting Tool Engineering found the average vertical machining center may be productive only 34% of available time after accounting for setup, loading, and maintenance. Machines look busy. They're often not cutting.
OEE (Overall Equipment Effectiveness) is the metric that closes this gap. It converts the vague sense that "the shop is running" into a precise number: what percentage of planned production time actually produced good parts, at full speed, with no unplanned stops.
This post covers what typical OEE looks like for traditional CNC machines, why scores land where they do, what the Six Big Losses are doing to your numbers, and what it takes to move them.
Key Takeaways
- OEE.com reports most manufacturers run closer to 60% OEE, with many falling below 45%
- The 85% "world-class" benchmark came from 1970s Japanese automotive lines — not mixed CNC job shops
- OEE = Availability × Performance × Quality; whichever component is lowest dominates the total score
- For most CNC shops, Availability is the primary drag — reactive maintenance, changeover overruns, and job gaps consume more time than slow feeds or scrap
- Manual tracking understates losses — operators miss micro-stops, and shift-end estimates don't capture accumulated idle time
- Recovering 10–15 OEE points on existing machines can eliminate capital equipment purchases entirely
What Is OEE for Traditional CNC Machines?
OEE answers one question: of the time you planned to run production, how much of it was truly productive?
The formula, as defined by OEE.com, is:
OEE = Availability × Performance × Quality
The Three Components Explained
Availability tracks run time against planned production time. In CNC environments, every minute lost to equipment failures, changeovers, material shortages, and program loading delays pulls this number down.
Availability = Run Time ÷ Planned Production Time
Performance captures speed losses during actual run time. Common CNC culprits include:
- Feed rate overrides left below 100% from a previous job
- Tool wear forcing reduced cutting speeds
- Excessive air cutting between operations
- Minor stoppages that never make it into a shift log
Performance = (Ideal Cycle Time × Total Parts) ÷ Run Time
Quality is the ratio of good parts to total parts produced. CNC shops often post their strongest scores here, but quality losses are disproportionately expensive. Each scrapped part carries the full cost of machine time, tooling, and material already consumed.
Quality = Good Count ÷ Total Count
OEE only measures time that was planned for production. Weekends, scheduled maintenance windows, and planned shutdowns are excluded by design — making OEE a true efficiency indicator rather than a utilization metric.
Typical OEE Benchmarks for Traditional CNC Machines
The 85% "world-class" OEE benchmark gets cited constantly in manufacturing circles. The origin matters: Seiichi Nakajima's Total Productive Maintenance work in 1970s Japanese automotive manufacturing — high-volume, repetitive, dedicated assembly lines with minimal changeovers. That context matters enormously when you're running a high-mix job shop with 40 different part numbers per week.
OEE.com confirms that most manufacturers are closer to 60% OEE, and many run below 45%. For CNC environments specifically, expect meaningful variation based on shop type:
OEE Ranges by CNC Shop Type
| Shop Type | Typical OEE Range | Key Driver |
|---|---|---|
| High-volume CNC production (automotive fasteners, dedicated fixturing) | 75–85% | Long runs, minimal changeovers |
| High-mix, low-to-mid volume job shops | 40–60% | Frequent changeovers, short runs, program variation |
| 5-axis aerospace and precision machining | 50–70% | Complex setups, first-part inspection holds, dry-runs |
| Shops just beginning to track OEE | ~40% or below | Losses previously invisible |
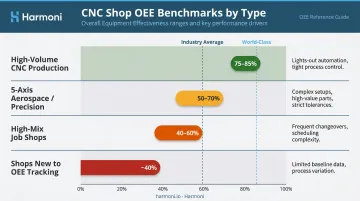
CNC-specific benchmark data from authoritative independent sources is genuinely thin. The ranges above reflect industry patterns from available case examples and practitioner experience rather than a single verified study. A 2015 IOSR Journal case study of a CNC boring and milling machine, for instance, found initial OEE of 62% improving to 75% after focused improvements — consistent with these ranges but not a universal benchmark.
A high-mix job shop consistently hitting 55–65% OEE is performing well given its operating conditions. Chasing 85% in that environment is the wrong goal.
The Six Big Losses Driving Low CNC Machine OEE
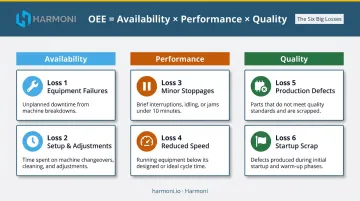
The Six Big Losses framework — developed alongside Total Productive Maintenance — gives you a structured way to diagnose exactly where OEE is being consumed. Each loss maps to one of the three OEE components.
Availability Losses
Loss 1 — Equipment Failures (Unplanned Downtime)
Reactive maintenance is the dominant availability drain in traditional CNC shops. A machine fails, production stops, maintenance responds.
Without actual runtime-hours data from controllers, PM schedules are built on calendar intervals that have no relationship to how hard the machine has been running. The result: over-serviced machines during slow periods and under-serviced ones when production is heavy.
Loss 2 — Setup and Adjustments (Planned Downtime)
Changeover time is chronically underestimated when operators self-report on paper logs. The gap between estimated and actual setup time is consistently larger than shops expect. One common mistake makes this worse: excluding changeovers from OEE calculations entirely. That hides one of the most actionable improvement opportunities available.
Performance Losses
Loss 3 — Minor Stoppages
Micro-stops under five minutes almost never appear in manual logs. An operator clears a chip jam, resets a sensor, or restarts a cycle, and before anyone writes anything down, the machine is running again. Accumulated across a shift, these invisible interruptions can consume more production time than logged major breakdowns.
Loss 4 — Reduced Speed
Without live cycle data, there's no way to know whether a machine is running at its programmed feedrate or has been dialed back. Feed overrides left below 100% from a previous job, aging tooling forcing conservative speeds, and excessive air cutting all reduce Performance without triggering an alarm or requiring a log entry.
Quality Losses
Loss 5 — Production Defects (Scrap and Rework)
In CNC environments, a single scrapped tight-tolerance part can represent hours of cycle time and substantial material cost. On a high-cycle machine, one bad aerospace component can do more damage to a day's OEE than an hour of downtime.
Loss 6 — Startup Scrap
First-part scrap at the start of each new run is a known problem that standard OEE discussions often underplay. A CNC-specific cause that rarely gets named: incorrect program revisions being loaded. An older version with a superseded toolpath produces wrong-dimension parts before anyone catches it.
This is particularly damaging in high-mix environments where programs change frequently and version control is manual.
Real-World OEE Walkthrough: A Traditional CNC Job Shop
Consider a representative scenario: a high-mix job shop running 20 machining centers across two shifts, supplying aerospace and defense OEMs. Leadership feels capacity pressure. There's no systematic OEE visibility: just a general sense that machines are running and jobs are late.
When measurement begins, the pattern is consistent across shops in this situation:
- Availability dragged down by reactive maintenance and changeover overruns that took longer than operators estimated
- Performance eroded by unlogged micro-stops and feed overrides left below target from job to job
- Quality losses concentrated in first-part scrap and program revision errors — events that were happening but never showing up in production records
On manual tracking, this shop might report 65% efficiency. Automated monitoring typically reveals the real number is closer to 50–53%.
The Capacity Math
The recovery opportunity is substantial. If that shop moves from 53% to 70% OEE across 20 machines, the throughput gain is significant:
(0.70 − 0.53) ÷ 0.53 = ~32% more good-part output from the same equipment, same floor space, same headcount
That's capacity the shop has already paid for in machine payments, lease costs, and labor. It doesn't require a capital purchase. It requires knowing where the time is going.
That investment is larger than most shops realize. Modern Machine Shop notes that the initial purchase price of a machining center may represent only 20–25% of total lifecycle cost. Every OEE percentage point recovered is a return on an investment already made.
How to Improve OEE on Traditional CNC Machines
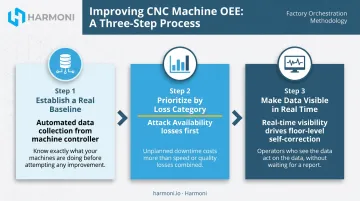
Step 1 — Establish a Real Baseline
The first requirement is data you can trust. Manual tracking systematically understates losses because operators don't log short stops and shift-end estimates rely on memory. Real improvement starts with automated, continuous data collection from the machine controller — reading feeds, speeds, alarms, and cycle states — not inferred from an external sensor counting spindle rotations. Without an accurate baseline, you're optimizing against a number that's already wrong.
Step 2 — Prioritize by Loss Category
The fastest OEE improvement comes from attacking the largest loss category first. For most CNC shops, that's Availability, not Performance or Quality.
- Recovering idle time and reducing unplanned downtime delivers more throughput per dollar than shaving cycle times
- Cutting cycles aggressively without the data to back it up risks tool breakage and scrap
- Changeover reduction alone — simply measuring actual versus standard time — often reveals recoverable hours that leadership didn't know existed
Step 3 — Make Data Visible in Real Time
Visibility alone changes behavior before any process is formally changed. When operators and supervisors can see micro-stops accumulating, changeovers running long, and performance dropping in real time, self-correction happens on the floor without waiting for a management review.
This is where platforms like Harmoni add direct value. Harmoni's factory orchestration platform sits between ERP systems, machines, and operators — combining real-time machine signals with operator activity and job routing data so that every OEE loss is linked to a cause and an owner, not just a timestamp.
Harmoni customers like WessDel have documented measurable results from that visibility:
- 17 productive hours gained per employee per month by eliminating manual transaction overhead
- 5X return on ongoing platform costs
- 10% reduction in late deliveries
How Harmoni Helps CNC Shops Close the OEE Gap
Raw machine data tells you a machine stopped. It doesn't tell you why, who was running it, which job was active, or whether the work instructions loaded were the right revision. That operational context is what converts a monitoring alert into an actionable response.
Harmoni's platform provides this by integrating machine signals, operator identity (via long-range RFID), job routing from ERP, and engineering requirements into a single real-time view. Specific capabilities relevant to OEE recovery include:
- Real-time OEE dashboards at the machine and shift level, flagging Availability, Performance, and Quality losses as they happen — not in a post-shift report
- RFID-based operator and job detection that auto-identifies who's running what, eliminating the manual log bias most shops use to undercount actual losses
- Native CNC control integration with Fanuc, Haas, Mazak, Siemens, Heidenhain, DMG Mori, and Makino — no machine modifications required
- Automated CNC program loading that delivers the correct program revision to the machine before the job starts, directly cutting startup scrap from revision errors
- Bi-directional ERP integration with Epicor, Infor, and JobBoss, tying shop floor performance to production orders and job costing in real time
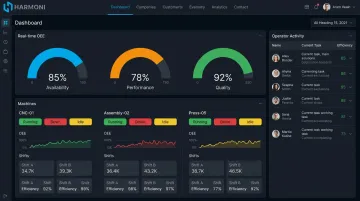
Harmoni deploys in weeks, not months, and works with existing equipment regardless of age. For defense and aerospace shops with ITAR or CMMC requirements, a Government Cloud deployment option is available.
Frequently Asked Questions
What is considered a good OEE?
The 85% world-class benchmark applies to high-volume, repetitive discrete manufacturing. For general discrete manufacturers, OEE.com reports 60% is typical and below 45% is common. For high-mix CNC job shops, consistently achieving 55–65% is a strong result.
Can OEE be above 100%?
No. Correctly calculated OEE cannot exceed 100%, since it measures productive time as a share of planned production time. If a calculation produces a number above 100%, the Ideal Cycle Time input is almost certainly set too low, making the machine appear faster than its theoretical maximum.
What are the Six Big Losses in OEE?
The six losses are Equipment Failures, Setup and Adjustments, Minor Stoppages, Reduced Speed, Production Defects, and Startup Scrap. They map to Availability, Performance, and Quality respectively — giving operations teams a structured framework for diagnosing exactly which category is dragging down overall efficiency.
What is the typical OEE for a CNC machine shop?
Most CNC job shops run 40–60% OEE, high-volume CNC production shops can reach 75–85%, and precision or aerospace operations typically fall in the 50–70% range. The wide variation is driven by changeover frequency, product mix complexity, and how consistently performance data is collected.
What causes low OEE on traditional CNC machines?
The top drivers are reactive maintenance causing unplanned breakdowns, micro-stops that go unlogged, changeovers running longer than standard, feed overrides left below target, and first-part scrap from incorrect program revisions. Most of these losses go undetected without automated data collection directly from the machine controller — manual logs and operator estimates routinely miss them.