OEE (Overall Equipment Effectiveness) is the single number that reveals how much of your theoretical production capacity actually converts into good parts. Improving it requires addressing equipment downtime, speed losses, and quality defects simultaneously — and results vary widely depending on where improvement efforts are focused.
This guide covers the Six Big Losses behind most OEE gaps, proven strategies high-performing manufacturers use to close them, common mistakes that undermine improvement efforts, and the technologies that accelerate sustainable gains.
Key Takeaways
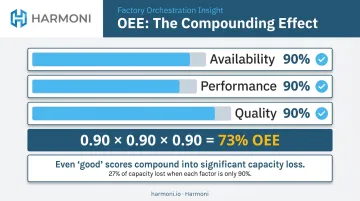
- OEE = Availability × Performance × Quality — scoring 90% on each component individually still produces only ~73% overall OEE
- The Six Big Losses (unplanned stops, planned stops, micro stops, slow cycles, startup rejects, production rejects) account for nearly all OEE gaps
- Improving OEE requires preventive maintenance, real-time data visibility, standardized operator processes, and a continuous improvement cycle — sustained discipline, not a single initiative
- Technology accelerates gains when it automates data collection and drives action at the workcenter level, not just reporting at the plant level
What OEE Actually Measures — And What World-Class Looks Like
OEE is calculated by multiplying three percentages together:
- Availability — actual run time divided by planned production time
- Performance — actual output divided by theoretical output at ideal cycle speed
- Quality — good parts divided by total parts produced
The compounding effect is what catches most manufacturers off guard. As the OEE framework shows, scoring 90% on all three components produces an overall OEE of just 73% — meaning even a facility that appears to be running well is losing more than a quarter of its productive capacity.
What "World-Class" Actually Means
The 85% OEE benchmark traces back to Seiichi Nakajima's foundational TPM work, introduced in the original 1984 Japanese publication and published in English as Introduction to TPM in 1988 by Productivity Press. Prize-winning Japanese plants were achieving above 85%, and that threshold became the reference point for world-class performance.
Industry scores vary considerably, though. LNS Research benchmarking of 350+ discrete manufacturers found wide spreads across sectors:
- A&D and semiconductor manufacturers often score well below 85%
- Industrial equipment manufacturers frequently cluster above it
- Electronics manufacturers ranged broadly between 70% and 90%
Chasing 85% as a universal target is less useful than pinpointing which component — Availability, Performance, or Quality — is your facility's primary constraint. Narrowing to that constraint is where measurable gains actually come from.
The Six Big Losses: What's Really Costing You OEE
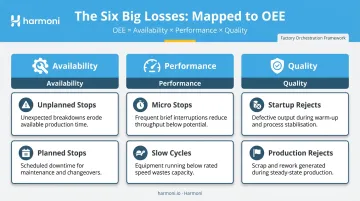
The Six Big Losses, mapped to their OEE component:
| OEE Component | Loss Category |
|---|---|
| Availability | Unplanned stops, Planned stops |
| Performance | Micro stops, Slow cycles |
| Quality | Startup rejects, Production rejects |
Availability Losses
Unplanned downtime — equipment breakdowns and unexpected failures — is the most disruptive availability loss. When a machine isn't running, Performance and Quality become irrelevant.
Planned downtime (changeovers, setups, PM windows) is easier to schedule but frequently undercounted. Many facilities measure changeover time as "machine stopped to machine running" — but true changeover loss spans from the last good part of the previous run to the first good part of the next run. That gap is almost always longer than logged.
Performance Losses
Micro stops — brief interruptions under five minutes from jams, minor adjustments, or material flow issues — are among the most underreported losses in manufacturing. Industry sources note that in metal fabrication, minor stoppages often blend into normal work and go unmeasured despite significant cumulative impact. Automated real-time data collection is frequently the only reliable way to capture them.
Slow cycles occur when equipment runs below its designed ideal speed — often because operators have dialed back speed to compensate for a recurring jam or material inconsistency. The machine is technically running, so no downtime is logged. But the capacity loss is real and continuous.
Quality Losses
Startup rejects occur after each changeover as the process stabilizes. Inconsistent startup procedures, manual parameter settings, and the absence of operator guidance during the transition add to these losses. Automated parameter verification and standardized startup checklists significantly reduce them.
Production rejects result from process variability during normal operation. Consistent operator execution and real-time quality checks at the workcenter directly cut reject rates and protect your Quality score.
Best Strategies to Improve OEE in Manufacturing
Implement Preventive and Predictive Maintenance
Moving from reactive to proactive maintenance is the most direct path to improving Availability.
Preventive maintenance — regularly scheduled inspections, lubrication, and wear part replacement — catches deterioration before it causes an unplanned stop. The cost difference between planned and unplanned maintenance is significant: DOE/FEMP benchmarks place reactive maintenance at $18/hp/year versus $9/hp/year for predictive programs, with predictive approaches delivering approximately 10:1 ROI and 35–45% downtime reduction.
Predictive maintenance goes further by using sensor data and condition monitoring to forecast failures before they occur. Deloitte Insights research found that predictive maintenance can improve equipment uptime and availability by 10–20%, reduce maintenance planning time by 20–50%, and cut overall maintenance costs by 5–10%. The core advantage: maintenance teams schedule repairs during planned downtime windows rather than scrambling during active production.
For automotive manufacturers specifically, the stakes are acute — Siemens/Senseye's 2024 report found unplanned downtime costs automotive plants an average of $2.3M per hour.
Reduce Changeover Time with SMED
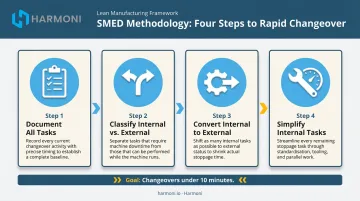
Developed by Shigeo Shingo for Toyota and published as A Revolution in Manufacturing in 1985, the SMED (Single-Minute Exchange of Die) methodology targets changeovers under ten minutes by:
- Documenting all changeover tasks — identify every step currently performed during the changeover window
- Classifying tasks as internal or external — internal tasks require the machine to be stopped; external tasks can be completed while the machine is still running
- Converting internal tasks to external — pre-stage tooling, pre-load programs, prepare materials before the machine stops
- Simplifying remaining internal tasks — quick-release fasteners, pre-assembled modules, standardized tooling reduce the time each internal step takes
Scheduling similar products back-to-back also reduces changeover frequency and setup variation between runs — compounding the availability gains the methodology creates.
LeanProduction notes SMED has achieved average changeover reductions of up to 94% in documented cases, including reducing 90-minute changeovers to under five minutes.
Build Real-Time Visibility Into Shop Floor Operations
Accurate, real-time data collection is the foundation every other OEE strategy depends on. Without it, loss categories get misidentified, improvement efforts get misdirected, and gains can't be verified.
Manual logging introduces two failure modes: timing errors (downtime that isn't logged until well after it occurs) and categorization errors (losses coded to the wrong category because the operator is recalling rather than recording). Both corrupt the OEE data that improvement decisions are built on.
Effective real-time visibility gives supervisors the ability to act while problems are still occurring — not the following morning during a shift report review. At minimum, a shop floor dashboard should surface:
- OEE performance by machine, shift, and workcenter
- Active downtime reason codes as they're logged
- Job progress against scheduled cycle time
- Exception alerts that trigger when performance drops below threshold
Harmoni unifies machine data, operator activity, and ERP workflows into one real-time view — so managers can see every machine's efficiency and status from any device and act on exception conditions without switching between systems.
The WessDel case study illustrates the downstream impact: by eliminating an 11-minute manual ERP transaction process, the facility gained 17 productive hours per employee per month — a result that traces directly to removing friction from data capture and job transitions.
Train Operators and Standardize Process Execution
Operator behavior influences all three OEE components directly:
- Availability — well-trained operators catch early warning signs before breakdowns occur
- Performance — operators who understand ideal cycle speeds don't compensate by slowing machines down
- Quality — consistent startup and quality procedures prevent defects that degrade the Quality component
A 2025 aerospace case study found that implementing lean manufacturing and standardized work increased aircraft availability from 60.56% to 83.75% and reduced mean time to repair from 7.3 to 3.8 hours per failure. The discipline of standardized procedures — not new equipment — drove those gains.
Accountability requires infrastructure. Digital work instructions, operator checklists, and visible expectations for each step of the job give operators the guidance they need at the exact moment they need it. Without that structure, even well-trained operators make inconsistent decisions that silently erode Performance and Quality over time.
That point-of-production guidance is where Harmoni's machine-side command centers come in — delivering work instructions, quality checksheets, and parameter guidance directly to operators, with RFID technology automatically matching the right instructions to the right job and machine.
Apply Continuous Improvement Methodologies
The IDA cycle (Information → Decision → Action) is a practical framework for structured OEE improvement:
- Collect accurate OEE loss data, broken down by loss category
- Run Pareto analysis to identify the single largest contributor to lost production time
- Select focused countermeasures for that top loss
- Implement within a defined timeframe
- Measure the outcome before moving to the next loss
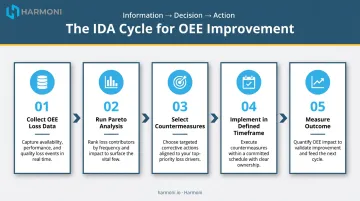
This prevents the scattered "improve everything at once" approach that produces no measurable results.
TPM (Total Productive Maintenance) extends equipment responsibility beyond the maintenance team. When operators own daily checks and spot problems early, issues get caught before they become availability losses. Case evidence supports this consistently: an automotive component study using TPM improved OEE from 68.60% to 84.83%, with availability rising from 90.70% to 95.30% and quality from 89.39% to 96.05%.
Pairing TPM with Lean waste elimination and Six Sigma variability reduction covers the full loss spectrum — but the IDA prioritization step keeps efforts concentrated where the constraint actually lives.
Common Mistakes That Undermine OEE Improvement
Execution gaps — not flawed strategy — are what typically derail OEE improvement programs. These four mistakes show up repeatedly across facilities of every size:
- Collecting data without acting on it — dashboards and monitoring tools only produce results when paired with a decision-making rhythm: regular top-loss reviews, structured shift meetings, and time-bound improvement cycles. Without that structure, data is just overhead.
- Optimizing the wrong component — chasing 85% OEE without knowing whether Performance or Quality losses are responsible for the gap means improvement effort lands in the wrong place.
- Skipping baseline measurement — without a reliable baseline by machine, shift, and product type, there's no way to separate real gains from natural variation — and no reference point to measure countermeasures against.
- Excluding frontline operators — operators hold the most direct knowledge of why machines slow down, stop, or produce rejects. Improvement teams that skip that input lose their highest-value source of root cause insight.
Technologies and Tools That Accelerate OEE Improvement
Matching Tools to the Right Visibility Gap
The right technology depends on where the primary visibility gap exists:
| Primary Loss | Technology to Prioritize |
|---|---|
| Availability losses | Machine monitoring / IIoT sensors for uptime tracking |
| Performance losses | Production analytics platforms for cycle time trends |
| Quality losses | SPC / in-process quality tools for variation detection |
IIoT sensors, MES systems, and dedicated OEE software automate the most error-prone part of OEE tracking: data collection. They deliver accurate, real-time data without relying on manually entered operator logs. Aberdeen's 2007 manufacturing intelligence benchmark found Best-in-Class manufacturers at 88% OEE, with those firms more than twice as likely to implement enterprise manufacturing intelligence tools and 46% more likely to use them for continuous improvement.
Factory Orchestration vs. Traditional Machine Monitoring
Traditional machine monitoring captures machine states. Factory orchestration platforms go further by sitting between ERP systems, MES systems, machines, and operators — coordinating all four simultaneously.
Many OEE losses aren't machine-driven. Wasted operator time, missing or incorrect work instructions, poor job sequencing, and ERP-to-floor disconnects all degrade Availability, Performance, and Quality without triggering a single machine fault. A platform that only monitors machines misses these losses entirely.
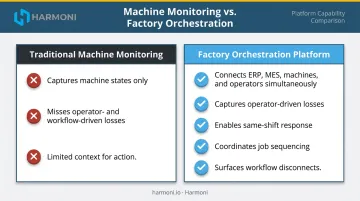
Harmoni's factory orchestration platform captures these operator- and workflow-driven losses as they occur, giving production teams the context to act within the same shift. The platform deploys in weeks (WessDel's installation was complete in under a week), and measurable operational improvements begin from day one, with documented results including a 22% scrap reduction within two months of implementation at one machine shop.
What to Look for When Evaluating OEE Technology
- Integrates with your existing ERP and machine control types without requiring replacement
- Delivers data at the workcenter and machine level, not just aggregate plant-level reporting
- Supports visibility into both machine performance and operator activity
- Lets supervisors act on alerts from a single interface, without switching between systems
- Deploys quickly and shows measurable operational improvement early — not after a 12-month implementation
Frequently Asked Questions
Frequently Asked Questions
What does 85% OEE mean?
85% OEE means 85% of theoretical maximum production time is converting into good output. It's widely cited as the world-class benchmark, originating from Nakajima's TPM work, but it's a directional reference rather than a universal target. The right benchmark varies by industry, process type, and automation level.
What are the six big losses in OEE?
The six losses map to three OEE components: Availability (unplanned stops, planned stops); Performance (micro stops, slow cycles); Quality (startup rejects, production rejects). Identifying which loss category is largest is the starting point for any improvement effort.
What are four ways to improve production?
The four highest-impact approaches: (1) reduce unplanned downtime through preventive and predictive maintenance; (2) minimize changeover time using SMED; (3) build real-time shop floor visibility and act on top losses systematically; (4) standardize operator processes and training to eliminate execution-driven losses.
What is a good OEE score for manufacturing?
85%+ is frequently cited as excellent, but practitioner benchmarks suggest 60% is fairly typical for discrete manufacturers and 40% is not uncommon. Consistent, measurable improvement matters more than hitting an arbitrary number. Set targets based on your facility's starting point and primary loss categories.
How do you calculate OEE?
OEE = Availability × Performance × Quality. Availability is actual run time divided by planned production time; Performance is actual output divided by theoretical output at ideal cycle speed; Quality is good parts divided by total parts produced. All three are expressed as percentages and multiplied together.
How does operator behavior affect OEE?
Operators directly influence all three components: changeover execution affects Availability, running machines at designed speeds affects Performance, and following startup and quality procedures affects Quality. Digital work instructions, real-time process guidance, and operator accountability tools are among the highest-ROI levers available for improving OEE.