Introduction
CNC machines generate data every second they run. Yet most shops are still making decisions based on end-of-shift clipboards, operator-reported part counts, and gut feel — by which point the production loss has already happened.
The problem isn't a lack of data. It's that manual collection lags behind real events, only 30% of facilities have automated equipment-capacity utilization tracking, and 62% report delays that directly affect throughput. The window to intervene closes before the report even gets written.
Effective CNC data collection means knowing what to collect, how to collect it reliably across a mixed fleet, and how to act on raw machine states before the shift ends — not just watching a dashboard fill up.
What follows covers the metrics worth tracking, where manual collection breaks down, how to connect mixed-age fleets reliably, and how to roll out a monitoring program without disrupting production.
Key Takeaways
- A small, well-defined dataset with consistent accuracy outperforms a massive, unreliable data stream
- Automated, real-time capture is the foundation for any improvement program — manual collection is too slow and too inconsistent to build on
- Standardize your state model before deployment, not after
- Machine data without ERP job context is descriptive but not actionable
- A three-machine pilot with one week of parallel validation is a lower-risk path than a fleet-wide rollout
What CNC Data Collection Actually Measures
CNC data collection is the automated process of capturing machine state, performance, and operational data directly from CNC controllers or connected sensors. It's distinct from broader "manufacturing data," which can include manual ERP entries, quality logs, and operator-reported counts.
The Minimum Viable Dataset
Shops that try to capture everything at once typically end up with unreliable data and low adoption. Start here instead:
- Timestamped machine states — run, idle, down, fault
- State durations — how long the machine spent in each state
- Stop counts — how many times the machine stopped, not just total downtime
- Cycle times — actual vs. scheduled
- Part counts — produced vs. target
- Alarm and fault codes — with timestamps
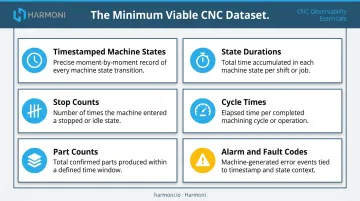
That's the foundation. A consistent, accurate version of this dataset is far more valuable than an inconsistent stream of 50 fields.
What Comes Later
Once that foundational dataset is clean and reliable, two natural extensions emerge:
- Predictive maintenance — vibration trending, thermal analysis, and tool wear monitoring
- Deep quality analytics — SPC, in-process inspection data, and defect correlation
Both are legitimate phase-two investments. Shops that bolt them onto an unstable foundation get expensive noise rather than actionable insight. Get production visibility right first, then layer in condition monitoring once the state data is trustworthy.
Why Manual Data Collection Creates a Hidden Performance Gap
Manual data capture has a structural problem: it relies on recall, happens after the fact, and is vulnerable to both honest error and quiet manipulation. By the time a supervisor logs a downtime event, the chance to fix it during the shift is gone.
The Perception vs. Reality Problem
The gap between what managers think utilization is and what it actually is tends to be significant. Modern Machine Shop's Top Shops benchmarking survey found median OEE of 73% for top-performing shops versus 65% for others — and those are already-connected, already-measuring facilities. Shops still on manual tracking routinely overestimate their numbers because the data they're measuring is incomplete.
When Machine Specialties, Inc. (MSI) (a 150,000-square-foot precision manufacturer) moved from manual tracking to automated monitoring integrated with their Epicor ERP, the system "almost eliminated errors in part counts" according to Modern Machine Shop. That's not a marginal improvement; it reflects how far manual counts can drift from reality.
Why It Undermines Continuous Improvement
Manual data doesn't just lag — it corrupts the analysis built on top of it.
- Downtime root cause analysis based on recalled reasons is unreliable
- Job costing built on operator-reported cycle times accumulates error across thousands of transactions
- Capacity planning becomes dangerously optimistic when it's built on overstated utilization numbers
Any continuous improvement program depends on accurate inputs. Automated, real-time collection is what makes those inputs trustworthy.
The Core Best Practices for Effective CNC Monitoring
These aren't vendor features. They're operational disciplines that determine whether a monitoring program delivers real value or becomes shelf-ware within six months.
Standardize Your State Model Before You Deploy
"Run/idle/down/fault" is not as simple as it sounds. A spindle running during warmup, tool touch-off, or a diagnostic cycle registers as "spindle on" — none of that is production time. If your state model doesn't account for these transitions, your utilization numbers will be wrong from day one.
Before deployment, define:
- The signal thresholds that trigger each state transition
- How warmup and setup time are classified
- Whether scheduled changeovers count as planned or unplanned downtime
- How each rule applies consistently across every machine brand and age
A state model that works correctly on a Haas but misclassifies warmup on a Fanuc will produce reports that can't be compared. Define the rules first, then configure.
Collect Data at the Right Frequency for the Right Purpose
Not all data needs the same collection rate:
| Use Case | Collection Frequency |
|---|---|
| State tracking, utilization, OEE | Event-driven or ~1 sample/second |
| Downtime and fault logging | Event-driven |
| Condition monitoring, vibration | 100+ samples/second |
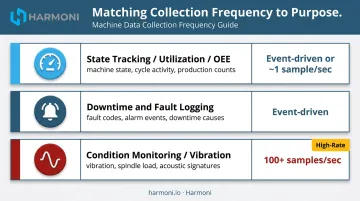
Collecting machine states at 100Hz generates storage overhead and processing cost with no additional insight for production monitoring. Collecting vibration data at 1Hz misses the signal patterns that matter for predictive maintenance. Match the frequency to the question being answered.
Combine Machine Data with Operator Context
Machine data tells you what happened. It can't tell you why. When a machine stops, the state is captured — the cause (tooling failure, material issue, programming error, scheduled changeover) requires human input to explain.
Best practice: surface a short, curated list of reason codes to operators only for stops that exceed a defined duration threshold (for example, stops longer than two minutes). Don't prompt operators for every micro-pause. That protects data quality without creating alert fatigue or adding friction to every interaction.
Platforms like Harmoni support structured downtime classification — changeover, breakdown, micro-stop, material wait, operator wait, quality hold — captured at machine-side terminals so operators never have to leave the workcenter to log a reason code.
Integrate Machine Data with ERP and Production Records
A machine showing 85% utilization means very different things depending on what job it's running. Without ERP context, utilization is a number with no direction.
When machine state data is matched against job records, planned cycle times, and production targets from the ERP, the dashboard tells you whether a machine is ahead of or behind plan. Supervisors see machine status and job progress against schedule — not just whether a spindle is turning.
Harmoni sits between ERP systems and CNC machines, combining machine data, operator activity, and job records into a single real-time view. That integration is what converts raw utilization percentages into actionable production intelligence.
Establish Governance: Define Who Owns the Data
This is where monitoring programs fail without fanfare. Without assigned ownership, reason code lists drift, signal calibrations go unnoticed after controller updates, and data quality erodes shift by shift until no one trusts the reports.
Assign ownership for:
- The reason code list (who adds, removes, or changes categories)
- Weekly data accuracy audits (who checks state totals against known events)
- Signal drift triage (who investigates when a machine's behavior changes after a firmware update)
Governance isn't glamorous work. It's the difference between a monitoring program that's still producing accurate data two years later and one that got quietly sidelined when the reports stopped making sense.
How to Collect Data from Any Machine — New, Old, or Mixed Fleet
Most real shops run a mixed fleet: some newer CNCs with modern connectivity, some mid-life machines with partial protocol support, and older units with no native data interface. The goal is not uniform wiring — it's a uniform output.
Three Collection Paths
1. Controller/native protocol connections For machines that support them, this provides the richest data — alarms, program identifiers, overrides, axis data, and spindle information. Common protocols include:
- MTConnect (open standard, where supported)
- FANUC FOCAS2 (0i, 30i, 31i, 32i)
- Haas NGC Q-commands / MDC
- Siemens SINUMERIK OPC UA
- Heidenhain DNC / StateMonitor interface
- Mazak/Mazatrol native interfaces
2. Discrete I/O or signal taps For older machines without network-accessible controllers. These read cycle-start, in-cycle, spindle-on, and fault relay signals already present in the cabinet — signals the machine uses internally. No modification to machine logic required.
3. External current or vibration sensors The last resort for machines with no accessible controls. Detects spindle-on state and stop events through power draw. Coarser than protocol-level data but sufficient for run/idle classification.
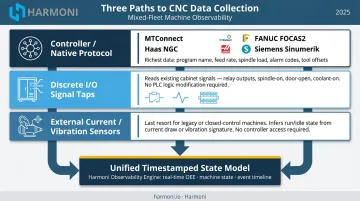
All three paths can feed the same timestamped state model. The collection method varies by machine; the output format doesn't.
Harmoni's Mixed-Fleet Approach
Harmoni's terminal puts this framework into practice. It includes a built-in MTConnect driver and OPC UA server, supports RS232/DNC for legacy serial-protocol machines, and acts as a translation layer — converting non-MTConnect data into MTConnect standard format. A shop running Fanuc 0i machines alongside a 1990s legacy unit can connect both to the same platform without replacing either.
Native compatibility covers:
- Fanuc, Haas, Mazak, Siemens, Heidenhain
- DMG MORI, Makino, Fadal
- MTConnect-native where supported
This eliminates most of the custom development that typically stalls mixed-fleet standardization.
The Edge Gateway Rule
The collection system must never sit in the machining loop. If the monitoring network drops, the machine needs to keep cutting. An edge device local to the machine collects and buffers data so that if connectivity goes down, machining continues unaffected and data is forwarded when the network recovers. Without this architecture, a network outage becomes a production stoppage — an unacceptable tradeoff.
Turning Raw Machine Data Into Actionable Shop Floor Decisions
Raw states and timestamps are not decisions. They become decisions when they're presented in a way that gives supervisors enough context to act during the shift — not after it ends.
From Reporting to Intervention
The practical shift is this: monitoring stops being a historical reporting tool and starts being an operational tool when the right person gets notified immediately — not at shift end. When a machine transitions to fault or has been idle beyond a defined threshold, someone needs to know now.
Harmoni's alerting system supports this through multiple channels:
- Visual Factory andon lights at the machine (green/yellow/red based on actual OEE, not just spindle state)
- SMS and email alerts for specific machine events and status changes
- Real-time dashboards accessible from any connected device
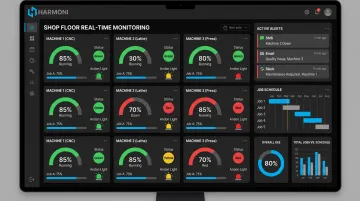
The distinction between "spindle running" and "performing within expected parameters" matters. An andon light that only reflects spindle state creates false confidence. One that reflects actual OEE against the job plan reflects reality.
Job Costing Gets Accurate When Cycle Times Are Real
When actual cycle times from the shop floor feed back into ERP job standards, quoting estimates improve over time. The MSI case illustrates this directly: their ERP-integrated monitoring system tracked earned hours rather than spindle time alone — meaning scrapped parts no longer counted as productive output. Part-count errors were nearly eliminated.
The margin impact of inaccurate cycle time standards adds up across every job — often invisibly until a quote falls short. Shops typically discover that quoted and actual cycle times diverge more than expected, and that divergence is where costing accuracy breaks down. Real-time machine data closes that loop.
Same-Shift Intervention Is the Highest-Value Use
Better costing is valuable — but real-time data earns its keep most during the shift itself. The weekly OEE report tells you what happened. Catching a utilization leak or a part count falling behind plan while the shift is still running gives you time to reallocate resources and keep the schedule intact.
Modern Machine Shop's machine-monitoring panel found that most companies see a 10–20% productivity increase when performance data becomes visible to the workforce. That lift doesn't come from better reports. It comes from faster intervention.
Rolling Out CNC Data Collection Without Disrupting Production
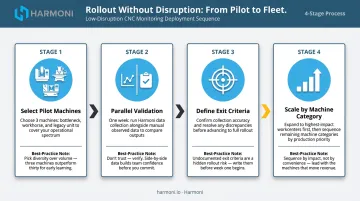
Start With Three Machines
Pick three that represent different categories: a bottleneck machine, a typical workhorse, and an older legacy unit. Run one week of parallel validation across all shifts — compare collected states against supervisor observation and existing records. If the data matches reality, the system is accurate and non-disruptive. If it doesn't, resolve it before scaling.
Piloting is risk management, not delay. Manufacturing-wide research from McKinsey found that 56% of manufacturers stall after their pilot — not because piloting is wrong, but because they never defined what "done" looks like before starting. Write the exit criteria before deploying hardware.
Once the pilot validates accuracy and workflow fit, you have the blueprint for a clean rollout. The most common disruptions at that stage aren't technical — they're process failures.
What Makes Installations Disruptive
Most rollout failures trace to process issues, not technology:
- Unscheduled cabinet access during active production
- Miswired signals discovered after go-live
- Last-minute network changes that affect machine operations
- Operator workflow additions that feel like extra work rather than replacements
Low-disruption installs pre-schedule all cabinet access during planned downtime windows, stage network onboarding machine by machine, and validate operator-facing changes in the pilot before asking anyone else to adopt them.
Define the Right Success Criterion
The measure of a successful rollout is not the number of data fields captured. It's decision speed. Can the operations team see same-shift utilization leakage and active downtime events clearly enough to act before the schedule slips? If the answer is yes, scale by machine category — starting with the highest-impact workcenter groups first.
Frequently Asked Questions
What does CNC mean?
CNC stands for Computer Numerical Control: a technology that uses programmed computer commands to automate the movement and operation of machine tools such as mills, lathes, and machining centers. It replaces manual operator control for applications requiring precision and repeatability.
What is the difference between real-time and batch CNC data collection?
Real-time (streaming) collection captures and displays machine states as they happen, enabling same-shift intervention. Batch collection aggregates data over time for historical reporting. Real-time collection is the standard for effective monitoring because production problems can't be corrected retroactively.
How do I collect data from older CNC machines without modern protocols?
Legacy machines without network-accessible controllers can be monitored using discrete I/O signal taps, which read cycle-start, spindle-on, and fault relay signals already present in the cabinet, or external current sensors. Both approaches can feed the same run/idle/down state model as modern CNCs with full protocol support.
What are the most important KPIs to track when monitoring CNC machines?
Core KPIs are machine utilization (run time vs. available time), OEE (availability × performance × quality), unplanned downtime frequency and duration, actual cycle time vs. standard, and part count vs. target. OEE is the anchor metric — it's the single number that reflects how well a machine is being used, and it's the right starting point before adding more granular tracking.
How does CNC data collection integrate with ERP or MES systems?
Machine data connects to ERP and MES systems via APIs, allowing actual cycle times to update job standards, machine events to trigger maintenance workflows, and production status to inform scheduling. That integration is only as reliable as the underlying machine data, so getting the state model right is the prerequisite.
Do all CNC machines support MTConnect?
MTConnect is supported by many modern controllers but is not universal. Older machines and some brands require proprietary protocols such as FANUC FOCAS2, Haas Q-commands, or Heidenhain interfaces, or fall back to discrete signal collection. A mixed-fleet monitoring strategy accounts for all connectivity types and standardizes outputs into a common state model regardless of collection method.