Introduction
Production data exists on your shop floor right now — inside CNC controllers, ERP work orders, and operator logs. The problem is that it sits in three separate places, and no one has a unified picture of what's actually happening until after the shift ends.
By the time that end-of-shift report lands, a machine that ran 20% below cycle time for four hours has already cost you. A quality drift that started at 10 AM is now in finished parts. There's no recovering that time or material.
According to a 2024 Zebra study, only 16% of manufacturing leaders globally report real-time work-in-progress monitoring across the entire manufacturing process. That means most facilities are making decisions on yesterday's data.
This article covers the four core types of real-time manufacturing dashboards used in factory automation, the key metrics each must display, how role-based views serve different stakeholders, and what separates a genuinely actionable dashboard from one that merely shows data.
Key Takeaways
- Real-time manufacturing dashboards draw from three data layers — machine signals, operator inputs, and ERP job data — but most platforms only capture one or two of them
- The four dashboard types (production, OEE, maintenance, quality) serve different operational questions and work best when deployed simultaneously
- Downtime categorization drives action; duration alone tells you nothing about what to fix
- A well-designed shop floor dashboard communicates operational status within five seconds, without text-reading or menu navigation
- Platforms like Harmoni are built for fast deployment — operators can be viewing live shop floor data within weeks of go-live
What Is a Real-Time Manufacturing Dashboard?
A real-time manufacturing dashboard is a live visual interface that aggregates data from machines, operators, and business systems into a single, continuously updated view. Shift summary reports and end-of-day ERP exports tell you what happened. A dashboard tells you what's happening now — while you can still act on it.
The Three Data Layers That Matter
Most platforms only connect to one or two of these layers, which creates critical context gaps:
- Machine-level data: spindle status, cycle times, machine state, alarm conditions
- Operator activity: job assignments, downtime reason codes, setup progress, part counts entered at the machine
- ERP/MES data — work orders, job targets, scheduling, labor cost allocation
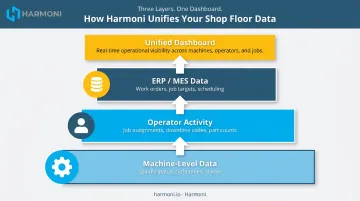
Platforms like Harmoni are built specifically to capture and present all three layers in a unified view — combining machine signals, operator inputs, and ERP job data so supervisors have the operational context that no single data stream provides alone.
Dashboard vs. SCADA: Not the Same Thing
SCADA is designed for equipment control and real-time monitoring of process parameters — it manages what a machine does. A manufacturing dashboard is designed for production decision-making, pulling from multiple systems to give supervisors and operators the operational context they need to manage performance. In most facilities, both systems coexist — SCADA handles equipment control at the process level, while the dashboard operates above it as the production management view.
The 4 Types of Dashboards Used in Factory Automation Software
Factory automation dashboards are not one-size-fits-all. Each type answers a different operational question, and effective facilities typically run more than one simultaneously.
Production Dashboards
The primary operator-facing view, production dashboards answer one question in real time: are we making what we're supposed to be making? They show:
- Current job progress and active work order
- Actual versus target unit counts per hour and per shift
- Cycle time performance against standard
- Whether the line is running ahead or behind schedule
OEE Dashboards
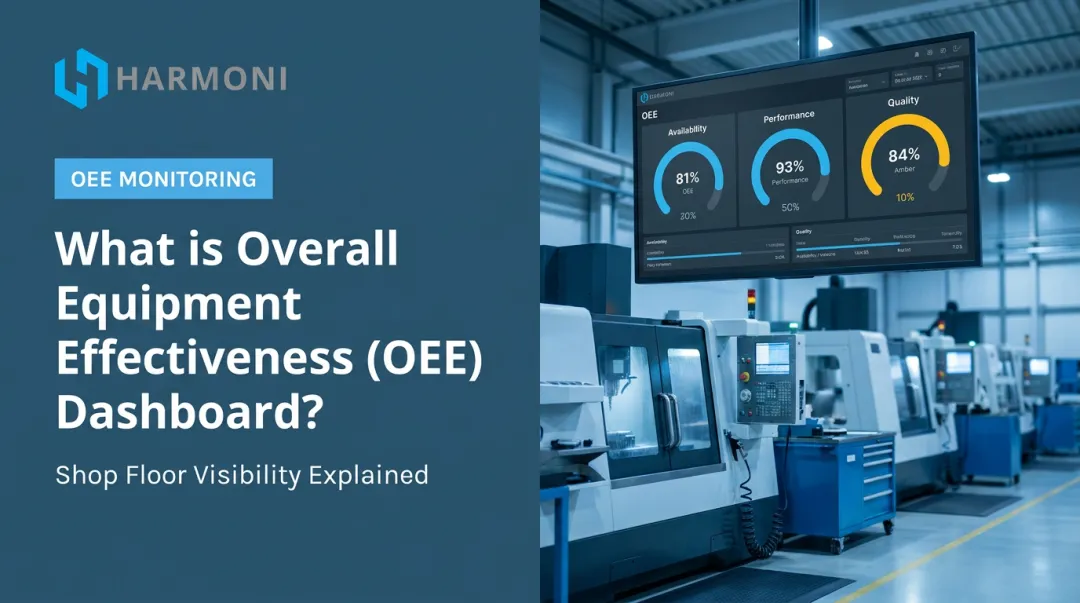
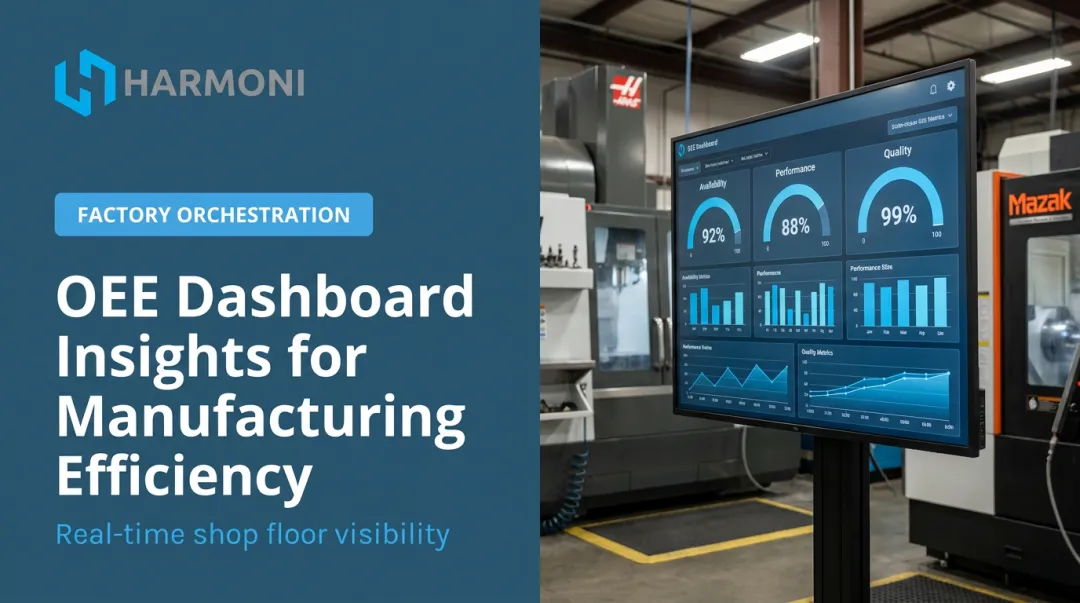
OEE (Overall Equipment Effectiveness) dashboards measure equipment performance across three dimensions: availability, performance, and quality. A real-time OEE dashboard calculates these metrics automatically from live machine data, allowing managers to compare current performance against historical baselines — for a single machine, a cell, or the entire floor.
Modern Machine Shop defines world-class OEE at 85% or higher, with top discrete manufacturers averaging around 73% versus 65% for the broader population. The gap between those numbers represents significant recoverable capacity.
Maintenance Dashboards
Maintenance dashboards surface machine health data, upcoming service requirements, and active fault conditions before they cause unplanned downtime. McKinsey research shows predictive maintenance typically reduces machine downtime by 30–50% and increases machine life by 20–40%. That shift from reactive to predictive only happens when maintenance teams have live data to act on — not work orders created after failure.
Common inputs that feed a maintenance dashboard include:
- Spindle hours and cycle counts by machine
- Active fault codes and alarm history
- Scheduled PM intervals and overdue service alerts
- Vibration or temperature anomalies from instrumented equipment
Quality Dashboards
Quality dashboards track defect rates, first-pass yield, scrap counts, and rejection reasons in real time. The operational value is timing: catching quality drift while the job is still running, rather than discovering a yield problem at final inspection when the entire batch is already complete.
Harmoni's digital quality checksheets feed directly into this layer. Operators enter inspection data at the machine as the job runs, and that data surfaces immediately to supervisors watching the dashboard — closing the loop between the floor and management without any manual reporting step.
Key Metrics Every Real-Time Factory Dashboard Should Display
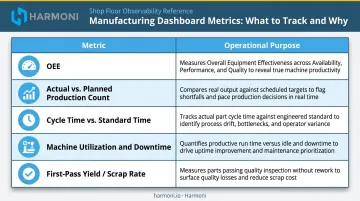
The specific KPIs should match the audience, but a core set spans all dashboard types:
| Metric | Why It Matters |
|---|---|
| OEE (or its sub-components) | Single composite view of equipment effectiveness |
| Actual vs. planned production count | Immediate schedule adherence signal |
| Cycle time vs. standard time | Performance efficiency indicator |
| Machine utilization and downtime | Availability tracking |
| First-pass yield / scrap rate | Quality dimension of OEE |
Why Downtime Categorization Beats Downtime Duration
Knowing a machine was down for 47 minutes is not actionable. Knowing it was down because of a setup delay, a material shortage, or a tool change — that gives a supervisor something to fix.
A machine can report a state change automatically. Only an operator can explain why it stopped. Dashboards that merge machine-reported states with operator-entered reason codes deliver the context that neither data stream provides alone.
Harmoni's platform captures this at the machine side, where operators log downtime reasons directly at their workcenter terminal without leaving their station.
Job Costing as a Dashboard Metric
Real-time labor and machine data flowing into ERP systems produces job cost accuracy that end-of-shift reporting cannot match. When actual cycle time and labor hours are captured live and pushed to the ERP job record as they occur, job costing reflects reality, not estimates adjusted after the fact.
This requires the dashboard layer to connect to both machine controllers and the ERP, not just one. Harmoni bridges this gap by tying CNC spindle data and RFID-captured labor time directly to ERP job records in real time. The WessDel case study demonstrated this measurably: manual time tracking was eliminated entirely, and job cost data became accurate from the first cycle.
Alert Thresholds: The Difference Between Watching and Knowing
A dashboard that only displays data passively requires someone to be watching it constantly. Effective dashboards use configurable alert triggers to push notifications to the right person immediately, rather than waiting for a supervisor to notice on their next floor walk.
Common trigger conditions include:
- Cycle time exceeds standard by a defined percentage
- OEE drops below a set threshold
- A machine enters an unexpected state
That shift from passive display to active notification is what separates a dashboard that informs from one that drives action.
The 5-Second Rule and Dashboard Design for the Shop Floor
A well-designed shop floor dashboard should communicate current operational status to any viewer within five seconds of glancing at it — without requiring them to read dense text, navigate submenus, or interpret complex charts. This is achieved through:
- Color-coded status indicators — green (running within expected performance), yellow (performance slipping), red (poor performance or downtime)
- Large typography — readable from across a work cell, not just at arm's reach
- Minimal top-level information density — summary status first, drill-down detail on request
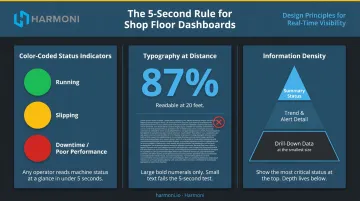
Harmoni's Visual Factory system reflects this principle at the physical level: high-intensity indicator lights visible across the shop floor communicate machine status at a distance, extending the same green/yellow/red logic beyond the screen.
Role-Appropriate Information Density
The underlying data is identical across roles — what changes is how much of it surfaces at the top level. Role-based display templates handle this directly:
- Operators at a CNC machine need one or two metrics: current job status and whether they're ahead or behind target
- Supervisors covering multiple machines need a multi-cell view showing all statuses at a glance
The same platform serves both audiences when it's designed with appropriately scoped views for each role.
Hardware and Input Considerations
Shop floor dashboard hardware is not one-size-fits-all:
- Screens mounted above equipment serve the whole cell at a glance
- Tablets or terminals at workstations serve the individual operator
- End-of-line displays serve inspection and transfer points
Input method matters too. Operators on a touchscreen while wearing gloves have different interface needs than supervisors reviewing dashboards on a desktop.
Harmoni's platform handles this directly: minimal-tap workflows reduce complex interactions like labor tracking from 11 minutes per transaction (as measured at WessDel) to a few screen taps. RFID-based job detection eliminates manual entry entirely in some workflows.
Role-Based Dashboard Views: Operator, Supervisor, and Executive
Operator Level
The operator dashboard must accomplish a specific set of tasks without requiring the operator to leave their station:
- Confirm the correct job is loaded and the right program is active
- Display current work instructions and process requirements
- Show progress against cycle time standard
- Allow flagging of a downtime event or quality issue immediately
Harmoni's RFID-based identification addresses the job-loading confirmation problem directly — the system detects which operator is at a workcenter and which job is active automatically, without manual check-in steps.
Supervisor Level
The supervisor dashboard answers a different question: what is the status of every machine in my area right now, and which ones need attention?
It must show:
- Real-time machine status across all cells (running, idle, in downtime)
- Which lines are behind schedule
- A shift summary actionable before the shift ends, not reviewed the next morning
Harmoni's manager-facing dashboards deliver performance tracking, bottleneck identification, and gap analysis at configurable cadences — live, hourly, shift, daily, and weekly — so supervisors can intervene while there is still time to recover.
Executive / Plant Manager Level
The executive dashboard answers strategic questions, not shift-level ones:
- Facility-wide OEE and throughput against schedule
- Labor utilization and job cost accuracy
- Performance trends that support capital and staffing decisions
This view must be accessible remotely. Harmoni supports dashboard access from any device, so a plant manager stays informed whether they're on the floor or off-site. In the MSI case study — a 300-person aerospace and defense manufacturer — that kind of unified visibility surfaced part count errors that had been slipping through undetected, directly reducing costly production mistakes.
What to Look for When Choosing a Real-Time Dashboard Platform
Four Non-Negotiable Integration Requirements
- Native machine connectivity: Pre-built connectors to the CNC controllers on your floor (Fanuc, Haas, Mazak, Siemens, DMG MORI, Heidenhain, Makino, Fadal). MTConnect support where controllers support it.
- ERP integration: Job and work order data from your ERP (Epicor, Infor, Infor Visual, JobBoss, JobBoss2, ABAS, ODOO) must flow into the dashboard, and actual production data must flow back.
- Operator input support: The platform must capture context at the workcenter level, not just machine signals.
- Genuine real-time refresh: Updates measured in seconds, not hourly batch cycles.
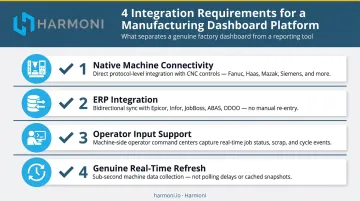
Harmoni's factory orchestration platform is purpose-built to sit between all of these systems — connecting CNC machines, major ERP platforms, and operator workcenters in a unified real-time view that deploys in weeks.
Deployment Speed Is Not a Secondary Question
A dashboard platform that requires months of custom integration work means weeks of downtime before your team sees any live data. Ask prospective vendors how quickly operators on the floor will see live data after implementation begins. Harmoni's deployment approach has factories running in weeks — the WessDel installation was complete in under a week, with operators viewing live data from day one.
Scalability and Configurability
Fast deployment only matters if the platform can grow with you. A dashboard that works for one line but can't scale to multi-cell or multi-shift operations quickly becomes a bottleneck. Look for:
- Role-based views that don't require rebuilding when you add a shift or a supervisor
- The ability to add machines or work centers without reconfiguring the entire system
- Pre-configured dashboards for the metrics that matter, with configurability where operations diverge from the standard
Harmoni's architecture supports additive growth. Adding a new machine brings its data into the same unified dashboard automatically.
Frequently Asked Questions
What are the 4 types of dashboards used in factory automation software?
The four types are: production (job progress, actual vs. planned output), OEE (availability, performance, quality), maintenance (machine health, fault conditions, downtime prediction), and quality (defect rates, first-pass yield, scrap tracking). Most automated factories run all four simultaneously, serving different views to operators, supervisors, and managers.
What is an OEE dashboard in factory automation software?
An OEE dashboard calculates Overall Equipment Effectiveness in real time from live machine data — across availability, performance, and quality — so plant managers can instantly see whether equipment is running as productively as possible. Current performance is compared against historical baselines at the machine, cell, or facility level.
What is the 5-second rule for dashboards?
The 5-second rule is a design standard requiring that any viewer can determine operational status within five seconds of glancing at a shop floor dashboard — achieved through color-coded status indicators, large typography, and a minimal top-level view. Detailed data lives in drill-down layers behind that primary view.
What data sources should a real-time manufacturing dashboard connect to?
A well-connected dashboard draws from machine controllers (CNC, PLC, or SCADA) for live equipment data, ERP or MES systems for job and scheduling data, and operator input systems for contextual information like downtime reasons, setup steps, and part count confirmations.
What is the difference between a manufacturing dashboard and a SCADA system?
SCADA monitors equipment parameters and machine behavior at the control layer. A manufacturing dashboard sits above it — aggregating data from machines, ERPs, and operators into an operational view that helps production teams manage performance. The two commonly coexist rather than compete.
How long does it take to deploy a real-time manufacturing dashboard?
Purpose-built platforms with pre-built machine and ERP connectors can have initial lines live within weeks. Harmoni's deployment at WessDel was complete in under a week, with operators viewing live data from day one. Custom-built or open-source solutions typically require months of development before production data reaches a screen.