Downtime itself is inevitable. A machine will fail, a changeover will happen, a conveyor will jam. What's not inevitable is running blind when it does.
This guide covers everything manufacturers need to build a practical downtime tracking program: what downtime tracking actually is, the difference between planned and unplanned stops, the metrics that matter, how manual and automated approaches compare, and how categorizing stop data correctly converts raw minutes into improvement actions.
Key Takeaways
- Downtime tracking feeds directly into the Availability component of OEE — making it one of the most impactful data points on the shop floor
- Planned and unplanned downtime require completely different responses; confusing them wastes improvement effort
- Machine availability, MTBF, MTTR, and reason code distribution are the core diagnostic metrics
- Manual logs typically miss short stops and produce inconsistent reason codes; automated tracking captures micro-stoppages and standardizes data at the source
- Pareto analysis on reason code data identifies the few failure types driving the majority of lost production time
What Is Equipment Downtime Tracking?
Equipment downtime tracking is the systematic process of recording, categorizing, and analyzing periods when machines or production lines are not running as planned — covering both scheduled and unscheduled stops.
The definition is straightforward. Getting it right is not.
Tracking goes beyond logging when a machine stops. It builds a data foundation for operational questions most shops still can't answer with confidence:
- Which equipment fails most often, and what's the typical pattern?
- Which shifts or work cells experience the most downtime?
- Are changeovers consistently running longer than the target time?
- Is equipment degrading — meaning failure frequency is increasing even if individual events seem routine?
The Connection to OEE
Downtime tracking feeds directly into Availability — the first component of Overall Equipment Effectiveness (OEE). Availability measures the percentage of planned production time when equipment is actually running. Every untracked stop is an invisible drag on that number.
According to OEE.com, world-class Availability sits at 90%, contributing to a world-class OEE of approximately 85%. Most manufacturers measure closer to 60% OEE overall — and Availability losses are frequently the largest contributor to that gap.
Tracking vs. Acting
Raw stop-time data only becomes actionable when it's categorized, surfaced in real time, and tied to maintenance or process workflows. A log of machine stops that no one reviews is just storage. The shift from tracking to improving happens when that data drives a specific decision — which machine to prioritize for PM, which shift to investigate, which changeover process to redesign.
Types of Equipment Downtime: Planned vs. Unplanned
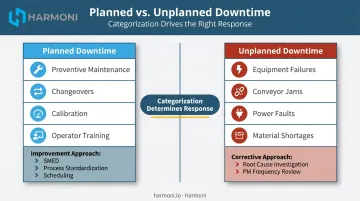
Planned Downtime
Planned downtime covers intentional, scheduled pauses during production time — distinct from time outside planned production windows like shift breaks or weekends.
Common examples include:
- Preventive maintenance — scheduled inspections, lubrication, component replacements
- Changeovers — tool changes, fixture swaps, program transitions between jobs
- Calibration and inspection — required at defined intervals
- Operator training — scheduled skill development during production hours
The fact that planned stops are expected doesn't make them free. Poor coordination or inefficient execution causes them to run longer than necessary. Tracking planned downtime against a target duration reveals exactly where to tighten. A changeover that targets 20 minutes but consistently takes 35 minutes is a process problem — one that only becomes visible when you're measuring against a baseline.
Unplanned Downtime
Unplanned downtime is any stop that occurs without prior scheduling. Common causes include equipment failures, conveyor jams, power or control system faults, material shortages, and labor gaps.
The scale of the problem is significant. Siemens' 2024 report found that large plants averaged 25 unplanned downtime incidents per month — down from 42 in 2019, but with average recovery times increasing to 81 minutes per incident.
Unplanned downtime is more costly than planned downtime for three compounding reasons:
- No preparation time — the line stops before anyone can stage materials, coordinate labor, or alert downstream processes
- Unpredictable duration — without knowing the root cause, recovery time is unknown
- Cascading costs — labor and overhead continue accumulating while output drops to zero; late deliveries and overtime costs follow
Why the Distinction Matters
How a stop gets categorized determines the corrective response — and misclassifying one wastes both time and resources.
- Planned stops are optimized through process standardization, better coordination, and SMED-style improvement
- Unplanned stops require root cause investigation, maintenance intervention, and potentially changes to preventive maintenance frequency
Without this distinction in the data, teams can't prioritize correctly. They may apply process improvement effort to equipment failures, or throw maintenance resources at changeovers that are actually a scheduling problem. Getting the categorization right is the foundation — everything in an effective downtime tracking system builds from it.
Key Metrics for Equipment Downtime Tracking
Total minutes lost is the starting point. But effective downtime tracking requires a set of metrics that together reveal equipment reliability trends, maintenance response efficiency, and program maturity.
Each metric below answers a different question. Used together, they form a complete picture of equipment health.
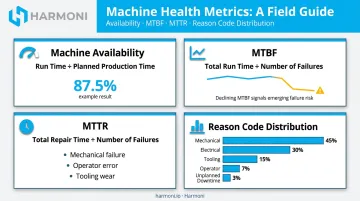
Machine Availability
Availability = Run Time ÷ Planned Production Time
Example: A machine has 480 minutes of planned production time. It experiences 60 minutes of downtime. Run Time = 420 minutes. Availability = 420 ÷ 480 = 87.5%.
Availability is the most direct output of downtime tracking. It's also one of the three components of OEE, meaning improvements here flow directly into the headline performance number.
MTBF (Mean Time Between Failures)
MTBF is the average operating time between unplanned failure events for a given machine.
Formula: Total Run Time ÷ Number of Failures
A declining MTBF trend over months signals equipment degradation: the machine is failing more frequently. This is the leading indicator that triggers a preventive maintenance review before a major failure occurs.
MTBF is most useful when tracked per machine over time, not as a single facility-wide average. A plant-wide MTBF figure can mask one chronically unreliable machine hidden among many reliable ones.
MTTR (Mean Time to Repair)
MTTR is the average time to restore a machine to operation after a failure.
Formula: Total Repair Time ÷ Number of Failures
High MTTR is usually a systems problem, not just a technical one. It often reveals:
- Spare parts unavailability — technicians waiting on components
- Gaps in troubleshooting documentation — no clear diagnosis path
- Technician skill deficiencies on specific equipment types
Reducing MTTR directly reduces the cost of every failure event, even if failure frequency stays the same. An 81-minute average recovery time — the large-plant benchmark from Siemens' 2024 data — represents significant production loss per incident.
Downtime by Reason Code and Unplanned vs. Planned Ratio
Aggregating downtime by reason code converts raw stop minutes into actionable intelligence. Over time, this data surfaces:
- Which failure types occur most often
- Which take longest to resolve
- Which are trending upward (emerging problems before they become crises)
The unplanned-to-total downtime ratio measures maintenance program maturity. A high unplanned proportion signals a reactive program — constant firefighting with no time for prevention. As that ratio shifts toward planned stops with shrinking total downtime, it's a reliable sign the program is gaining ground.
Methods: Manual vs. Automated Equipment Downtime Tracking
The Limits of Manual Tracking
Paper logs and spreadsheets have well-documented failure modes in downtime tracking:
- Short stops go unrecorded — a 4-minute jam gets cleared before anyone writes it down
- Timestamps are estimated — entries made at shift end reflect memory, not the clock
- Reason codes are generic or guessed — operators circle "other" rather than think through the real cause
- Under-reporting is socially incentivized — in shops where downtime is tracked against operators, there's a personal cost to accurate recording
Manual downtime logs often miss short stops entirely and produce inconsistent reason-code data, meaning every downstream metric is built on an incomplete foundation.
What Automated Tracking Changes
Machine-level sensors and platform integrations detect every state change (running, idle, or stopped) with precise timestamps, without requiring operator input at the moment of failure. Operators assign reason codes after the line restarts, when they have the context and mental space to be accurate.
One pattern worth anticipating: when manufacturers switch from manual to automated tracking, reported downtime typically increases initially. This is not operational decline. Previously invisible events — short stops, micro-interruptions, brief idle periods — are now counted. The floor didn't get worse; the data got better.
Harmoni's Factory Orchestration Approach
Harmoni sits between ERP systems, machines, and operators as an orchestration layer rather than a single-machine monitor. The platform combines real-time machine state data with operator activity and ERP job context in one unified view, giving manufacturers operational context for each downtime event — not just a timestamp.
Harmoni's OEE module includes six default downtime categories that map directly to the Availability component of OEE:
- Changeover — planned time between production runs
- Breakdown — unplanned mechanical or system failure
- Micro-stop — brief interruptions under a defined threshold
- Material Wait — line paused pending incoming material
- Operator Wait — machine ready but operator unavailable
- Quality Hold — production stopped for inspection or rework
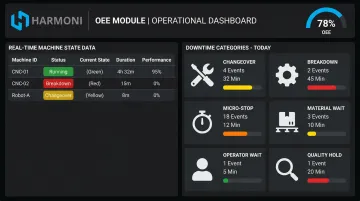
These categories align with the planned/unplanned distinction that drives corrective action.
Harmoni connects to existing equipment without replacement, including legacy machines via RS232, analog/current sensors, or adapter layers. It integrates with major CNC controls: Haas, Fanuc, Mazak, Siemens, DMG Mori, Makino, Heidenhain, and Fadal. Most deployments are complete in weeks, meaning shops gain accurate downtime visibility without a long implementation cycle.
How to Categorize Downtime Data for Actionable Insights
Raw downtime data without categorization is just a timeline of stops. The reason code system is what transforms that timeline into improvement intelligence.
Building an Effective Reason Code System
An effective structure uses:
- Four to six top-level categories — broad enough to be intuitive, specific enough to drive different responses
- A two-level hierarchy — category plus sub-reason — that gives root-cause granularity without overwhelming operators at the line
Example top-level categories:
- Mechanical failure
- Electrical / controls fault
- Process or quality issue
- Planned maintenance
- Changeover
- Operator / external
Too many top-level options produce the same problem as too few: operators default to "other" or make arbitrary choices under time pressure.
Getting Operators to Code Accurately
The reason code system is only as good as the data operators put into it. Best practices:
- Keep the top-level list to six or fewer options
- Train operators on why coding matters, not just how — when people understand the feedback loop, accuracy improves
- Review reason code distributions weekly — a spike in "unknown" or "other" codes signals that the list needs clarification or operators need support
- Flag genuinely ambiguous stops for follow-up rather than forcing a guess that corrupts the data
Pareto Analysis: Where Improvement Effort Goes
Once reason code data accumulates over weeks and months, Pareto analysis reveals the "bad actors" — the small number of failure types or machines responsible for the largest share of lost production.
This is the mechanism that turns reactive reporting into a prioritized fix list your team can act on each week:
- Run a Pareto on reason code data to identify the top loss
- Confirm a concrete plan exists to address it
- Execute the improvement
- Re-run the Pareto to measure impact and identify the next target
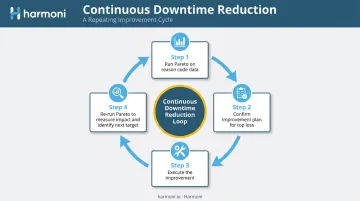
Teams that follow this cycle consistently shrink their unplanned downtime share — fewer emergency repairs, less firefighting, and more predictable throughput. That ratio shift is where maintenance stops being reactive and starts driving OEE gains.
Benefits of Consistent Equipment Downtime Tracking
Fewer Unplanned Stops Over Time
Accurate downtime tracking reduces unplanned stops by creating a feedback loop: patterns become visible, maintenance can act proactively, and teams shift from firefighting to systematic prevention.
The scale of improvement is meaningful. McKinsey research found that analytics-driven predictive maintenance typically reduces machine downtime by 30–50% and extends machine life by 20–40%. Those gains are achievable when downtime data is collected, analyzed, and acted on consistently.
Financial Impact
Every unplanned stop carries overhead and labor costs with zero production output. The financial logic is direct: fewer stops mean more throughput from the same resources, fewer late orders, and reduced overtime.
Real-time downtime visibility (the kind Harmoni's observability features provide) enables teams to identify problems while they are happening rather than discovering them after production is complete. A stop caught at 15 minutes costs far less than one discovered at 90 minutes during end-of-shift reporting.
Team Alignment
When operators, maintenance technicians, and supervisors all work from the same real-time downtime data, they develop a shared language and shared priorities. Downtime stops being a blame-assigning exercise ("who caused the stop?") and becomes a collaborative problem to solve.
WessDel, a precision manufacturer using Harmoni, described this kind of platform-driven visibility becoming "the primary tool to manage our factory," with measurable results including:
- 10% reduction in delinquent jobs
- 17 productive hours gained per employee per month through reduced manual transaction time
Those results depend on data that's visible, timely, and shared across every role on the floor — not siloed in a single report reviewed after the shift ends.
Frequently Asked Questions
What is downtime tracking?
Downtime tracking is the process of recording, categorizing, and analyzing periods when equipment is not running as planned — both scheduled and unscheduled stops. The goal is to surface patterns and root causes so manufacturers can make better maintenance and production decisions.
What is the difference between uptime and downtime in equipment?
Downtime is the portion of planned production time when a machine is not operating; uptime is the portion when it is running. Uptime is not the same as fully productive time — a machine can be running but producing at reduced speed or generating defects, both of which impact OEE beyond the Availability component.
How much downtime is 99.9% uptime?
99.9% uptime means 0.1% downtime — roughly 8 hours 46 minutes per year, 43 minutes 50 seconds per month, or about 10 minutes per week on a continuously operating asset. Even at that level, tracking is valuable — it reveals where those minutes are concentrated, not just how many there are.
What is the difference between planned and unplanned downtime?
Planned downtime covers scheduled stops — preventive maintenance, changeovers, calibration, and inspections. Unplanned downtime is any stop that wasn't scheduled, typically caused by equipment failure, process faults, or material shortages. The ratio of unplanned to total downtime is one of the clearest indicators of maintenance program maturity.
What metrics should manufacturers track alongside equipment downtime?
The core metrics are machine availability, MTBF (Mean Time Between Failures), MTTR (Mean Time to Repair), downtime by reason code, and the unplanned-to-planned downtime ratio. Together, they translate raw stop-time data into a clear picture of equipment reliability and maintenance program health.
How does downtime tracking improve OEE?
Downtime directly affects the Availability component of OEE. Reducing unplanned stops and tightening planned stop durations increases Availability, which flows through to a higher OEE score. Accurate tracking is what makes it possible to identify which losses are largest and measure whether improvement actions are actually working.