OEE (Overall Equipment Effectiveness) monitoring makes that gap visible. More importantly, it makes it actionable. This post walks through how each component of OEE maps to a specific category of financial loss — and how manufacturers can use real-time OEE data to protect and improve margins, not just chase a better score.
Key Takeaways
- OEE measures three things: how often equipment runs (Availability), how fast it runs (Performance), and how much good product it makes (Quality)
- Each component represents a distinct financial loss — downtime costs, throughput shortfalls, and scrap/rework expenses
- Real-time monitoring flags losses as they happen, so operators can correct problems within the shift — not after the fact
- Connecting machine data to operator activity and ERP job data explains why losses occur and enables targeted action
- Profit comes from acting on OEE insights — not from tracking the numbers alone
What OEE Is and Why It Directly Affects Your Bottom Line
OEE is a single composite score — expressed as a percentage — that reflects how effectively a piece of equipment is being used relative to its full potential. A score of 100% means producing only good parts, as fast as possible, with zero unplanned stops. No real-world machine hits 100%, but the benchmark matters because the distance from it represents real, recoverable profit.
According to LeanProduction/Vorne, 85% OEE is considered world-class for discrete manufacturers. The typical manufacturer sits around 60% — and manufacturers just beginning to track performance often discover they're closer to 40%. That 25-point gap between typical and world-class isn't just an efficiency story. It's a capacity story, and capacity has a dollar value.
The Financial Logic Is Direct
Every percentage point of OEE lost represents production time, throughput, or quality that can't be recovered without adding shifts, equipment, or headcount. That means OEE losses either increase cost or reduce output — and either way, margins compress.
The practical implication: manufacturers who improve OEE extract more output from the same labor, overhead, and capital investment they're already paying for. Before investing in new equipment or headcount, closing the OEE gap is the first place to look.
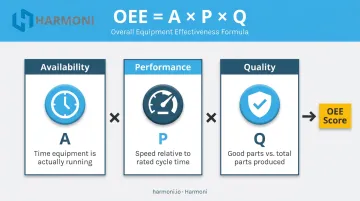
OEE is calculated as:
OEE = Availability × Performance × Quality
Each factor isolates a distinct category of loss:
- Availability — time lost to unplanned downtime, changeovers, and equipment failures
- Performance — speed losses when machines run slower than their rated cycle time
- Quality — output lost to defects, rework, and scrap
Understanding them separately is what makes improvement efforts targeted rather than generic.
How Each OEE Component Translates to Lost Revenue
Availability: The Cost of Downtime
Availability measures the percentage of planned production time a machine is actually running. When a machine is stopped unexpectedly, every fixed cost — labor, overhead, equipment depreciation — keeps accumulating with zero output to offset it.
The scale of that exposure is significant. NIST estimates that preventable maintenance issues cause $119.1 billion in annual U.S. manufacturing losses, including $18.1 billion attributable to unplanned downtime alone. An ABB survey found unplanned outages cost industrial businesses close to $125,000 per hour on average — and over two-thirds of those businesses experience at least one unplanned outage per month.
For a CNC shop running multiple machines across multiple shifts, even a few hours of untracked downtime per week adds up to tens of thousands of dollars in absorbed cost. There's no corresponding output to show for it.
Harmoni's OEE monitoring captures downtime with specific reason codes — distinguishing between changeover, breakdown, micro-stop, material wait, operator wait, and quality hold — so improvement efforts target the right problem instead of guessing.
Performance: The Revenue Left on the Table
Even when machines are running, speed losses quietly drain throughput. Performance captures this: a machine operating below its designed rate due to minor stoppages, slow cycles, or hesitation between operations. No alarms fire, no work orders get triggered — yet output shrinks with every hour.
Without real-time cycle time monitoring, a machine that ran at 70% of its expected rate all morning looks identical to one that ran at 100%. The loss only becomes visible after the shift ends, at which point nothing can be done about it.
Rather than measuring Performance against theoretical maximum speed, Harmoni compares actual cycle time to the estimated time in the ERP job definition. 100% Performance means the job ran at the rate it was quoted. That connection to ERP data ties performance directly to job costing — making speed losses visible in financial terms, not just OEE points.
Quality: The Double Cost of Defects
Quality measures the percentage of output that meets specification on the first pass. Scrap and rework carry a double financial penalty:
- The material and machine time already consumed to produce the defective part
- The additional time and resources required to either rework or replace it
ASQ notes that quality costs — including hidden costs — can reach 25% or more of sales in manufacturing environments. IISE puts the Cost of Poor Quality (COPQ) range at 5% to 35% of the sales dollar.
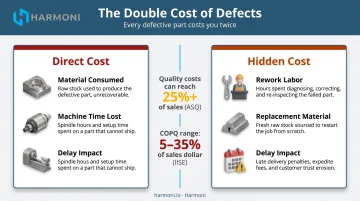
Improving first-pass yield is one of the highest-leverage OEE moves available because it eliminates cost without requiring any additional capacity. Harmoni's digital quality checksheets allow operators to enter scrap quantities and reasons at the machine terminal in real time, correlating quality events directly to the machine cycles that produced them — giving quality engineers the precise data needed to find and eliminate root causes before defect costs accumulate.
What Real-Time Monitoring Reveals That Manual Tracking Misses
The core limitation of end-of-shift OEE tracking is timing. By the time someone aggregates the data and reviews it, the window to intervene has closed. A machine that ran at 65% performance all morning cannot be corrected retroactively.
Real-time monitoring changes the equation. Supervisors can see losses while there is still production time left in the shift — and correct them.
Pattern Recognition That Aggregate Reports Hide
Real-time OEE systems surface patterns that shift summaries obscure:
- A specific machine consistently underperforms after a tool change
- Performance drops during the back half of night shifts
- Scrap rates spike on a particular part number or material lot
- Cycle times drift gradually without triggering any alarm
These patterns don't show up in weekly averages. They show in per-cycle data tracked across time.
Job Costing Accuracy
When OEE data ties to specific jobs — not just machines — operations leaders can see the true machine time and labor consumed per part. That data answers a question most job shops can't answer accurately: which jobs are actually profitable, and which ones are quietly eroding margins because they're taking longer than quoted?
Harmoni connects machine cycle data with RFID-tracked operator labor records and pushes that combined data to ERP systems — producing job costing that reflects what actually happened on the floor, not what was estimated.
WessDel, a precision machining shop producing aerospace components, reported gaining 17 productive hours per employee per month after implementing Harmoni, reducing ERP transaction time from 11 minutes down to seconds. That time recovery represented over 5x the ongoing cost of the platform.
Forecasting and Delivery Reliability
Consistent OEE tracking over time creates a reliable baseline for output forecasting. Knowing what a machine actually produces per shift, based on real availability and performance patterns, lets you make delivery commitments with confidence rather than optimism. That reliability directly affects customer satisfaction and, in high-mix environments, scheduling efficiency.
Turning OEE Data Into Profit-Improving Actions
An OEE score only has value when it drives action. Systematic follow-through on the data is where margin improvement actually happens.
Focus at the Machine Level First
Plant-wide OEE averages obscure the specific assets where losses concentrate. The most productive improvement approach starts with a single bottleneck machine : the one where losses are largest and where improvement delivers the largest measurable financial impact.
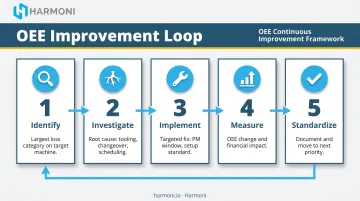
The improvement loop looks like this:
- Identify the largest loss category on the target machine (Availability, Performance, or Quality)
- Investigate root cause (changeover time, tooling wear, operator variability, scheduling gaps)
- Implement a targeted fix such as scheduling a preventive maintenance window, standardizing a setup procedure, or eliminating a specific quality source
- Measure the change in OEE and translate it to financial impact (output gained, scrap reduced, downtime avoided)
- Standardize the improvement and move to the next priority
Each cycle produces a documented before/after record. That record builds team confidence and makes the next improvement initiative easier to justify to leadership.
The Maintenance Connection
OEE Availability data is one of the best inputs for shifting maintenance from reactive to preventive. When downtime patterns show a specific machine failing predictably every third week or after a certain number of cycles, that machine is a candidate for scheduled intervention before failure.
The financial case for this shift is substantial. NIST found that establishments relying heavily on reactive maintenance experience 16 times more defects than those using advanced maintenance strategies.
Harmoni's custom alert system notifies supervisors of unexpected downtime events and performance deviations in real time. Operators can escalate breakdowns directly from their machine terminal, compressing the time between a problem occurring and a problem being resolved.
Make OEE Visible to the People Who Can Change It
Operators are the first line of defense against OEE losses but they can only act on information they can see. Harmoni puts that information directly at the machine: a touchscreen terminal displays real-time performance against the ERP job target, while an andon indicator light communicates OEE status at a glance (green for on-target, yellow for slipping, red for poor performance).
When operators can see their current performance in real time, they self-correct faster and escalate issues sooner. In practice, shops report that this visibility alone eliminates delays that previously went unnoticed until shift-end reviews.
Why Machine Data Alone Isn't the Complete Picture
A machine monitoring system that only collects spindle-on/spindle-off signals can tell you a machine was idle. It cannot tell you why.
Was it a mechanical fault? An operator waiting on a setup sheet? A job not yet queued from the ERP? A quality hold waiting for engineering sign-off? Each root cause requires a different corrective action. Without that context, improvement efforts get directed at symptoms instead of sources.
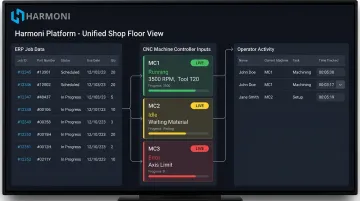
Three Data Streams, One View
The complete picture requires connecting:
- Machine data — cycle times, part counts, and spindle state reveal what the equipment is doing
- Operator activity — clock-in status, active job, and document access reveal who is engaged and how
- ERP job data — scheduled work orders, quoted times, and transactions reveal whether the floor is aligned with the plan
When these three streams are unified, an idle machine state becomes interpretable. The system can correlate machine status with whether an operator is clocked in, whether the job's setup sheet was opened, whether a work order is queued — distinguishing avoidable delays from genuine equipment failures.
That unified view is what Harmoni's factory orchestration platform delivers. Sitting between ERP systems, CNC machine controllers, and operators, Harmoni connects long-range RFID identification, direct machine controller data collection, and native ERP integration into a single view of the shop floor. Supported controls include Fanuc, Haas, Mazak, Heidenhain, Siemens, DMG MORI, Makino, and Fadal; supported ERPs include Epicor, Infor, JobBoss, ABAS, and ODOO.
The platform deploys in weeks without requiring machine replacement — Harmoni retrofits to existing equipment regardless of age or manufacturer, with built-in connectivity for RS-232, Ethernet, USB, and current-sensor inputs for older machines that lack modern control interfaces.
The result is OEE monitoring with operational context — a score tied directly to the specific people, jobs, and decisions behind it, so improvement efforts land where they'll actually move the number.
Frequently Asked Questions
What are the KPIs that make up OEE?
OEE is composed of three KPIs : Availability (actual run time vs. planned production time), Performance (actual cycle speed vs. ideal speed), and Quality (good parts vs. total parts produced). The composite score is calculated by multiplying all three together: Availability × Performance × Quality.
How do you improve OEE productivity?
The core levers are: reduce unplanned downtime through preventive maintenance, minimize speed losses by monitoring cycle times in real time, and improve first-pass yield by identifying and eliminating defect root causes. The data only creates value when acted on at the machine level — weekly report reviews alone won't move the number.
How can maintenance increase the profitability of a company?
Better maintenance directly improves Availability by reducing unplanned downtime events. Shifting from reactive to preventive maintenance using OEE trend data means fewer emergency stoppages and lower repair costs. NIST found that reactive-maintenance-heavy operations experience 16 times more defects than those using advanced strategies — a direct connection between maintenance discipline and revenue.
How do you improve profitability in manufacturing?
Profitability improves when output increases, costs decrease, or both happen simultaneously. OEE monitoring drives both outcomes by pinpointing exactly where production time, speed, and quality are being lost — so you generate more good parts from equipment and labor you're already paying for.
What is a good OEE score for manufacturing?
The commonly cited world-class benchmark is 85% OEE, while most discrete manufacturers operate around 60%. The most important metric isn't hitting a specific number — it's consistently trending upward from your own facility's baseline. A shop moving from 55% to 68% OEE is outperforming one that's been stuck at 72% for two years.
What is the difference between OEE and productivity?
Productivity measures output relative to inputs (parts per labor hour, for example). OEE measures how effectively a specific piece of equipment is being used across availability, speed, and quality dimensions. As a diagnostic tool, OEE explains the reasons behind your productivity number and identifies precisely where to focus improvement efforts.