Introduction
On a busy shop floor, information gaps cost real money. Operators stop mid-job to track down supervisors for status updates. Machines go down unnoticed until the shift review reveals hours of lost production. Job errors get traced back to operators working from the wrong revision — a drawing that changed two weeks ago but never made it to the floor.
These aren't edge cases. They're daily friction points in manufacturing environments where verbal communication and paper documentation are still doing the heavy lifting.
Visual factory management is the discipline of making the state of operations immediately obvious — to everyone, from operators to plant managers — without asking or searching. The tools range from floor tape and shadow boards to real-time digital dashboards and full factory orchestration platforms.
This guide covers what visual factory management actually is, the major categories of tools, how to implement them step by step, and where digital platforms extend beyond what physical tools can deliver.
Key Takeaways
- Visual factory management uses physical and digital cues to make production status, standards, and problems visible without verbal communication.
- Tools span from floor markings and Andon lights to OEE dashboards and ERP-integrated platforms.
- Core benefits: faster problem detection, fewer errors, less wasted operator time, stronger accountability.
- Digital platforms combine machine data, ERP data, and operator activity into one live view — going well beyond static displays.
- Implementation follows a clear path: audit gaps, prioritize displays, pilot one area, and keep visuals current.
What Is Visual Factory Management?
The Lean Enterprise Institute defines visual management as placing all tools, parts, production activities, and performance indicators in plain view so that system status can be understood at a glance. Visual factory management is the shop-floor-specific application of that principle — scoped to production performance, machine status, job routing, and safety.
The distinction matters. Visual management is a methodology that applies to any workplace. Visual factory management is tied directly to manufacturing operations: what is running, what should be running, and where to intervene.
The Lean Manufacturing Foundation
Visual factory management is rooted in the Toyota Production System and 5S methodology. Toyota's TPS is built on eliminating waste through Just-in-Time production and jidoka, which means stopping to fix problems as they occur rather than passing defects downstream.
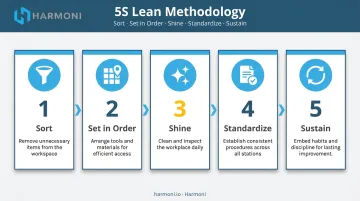
5S is the enforcement layer. LEI defines the five steps as workplace practices that create an environment that is self-explaining, self-ordering, and self-improving:
- Sort — remove anything that doesn't belong at the workstation
- Set in Order — assign a defined location to every tool and part
- Shine — keep the environment clean so abnormalities are visible
- Standardize — document and enforce the first three steps consistently
- Sustain — build habits and accountability to maintain the standard
Visual tools are how 5S sustains itself. When a location is labeled, a missing item is immediately obvious. No one has to ask.
The underlying logic applies across the entire floor. Verbal communication and printed documentation are forms of waste: they take time, risk misinterpretation, and go stale the moment they leave someone's hands. Modern digital tools — real-time dashboards, machine-side displays, and automated status indicators — carry that same principle forward, replacing static signals with live data.
Types of Visual Factory Management Tools
Physical Layout & Floor Organization
Floor markings, painted zones, FIFO lanes, and cell layouts form the foundation of any visual factory initiative. They require no training to interpret: a yellow line across a walkway communicates "pedestrians here" as clearly to a new hire on day one as to a 10-year veteran.
FIFO lanes preserve production sequence by making it physically impossible to pull material out of order. Cell layouts (processing steps placed immediately adjacent to each other) enable near-continuous flow by reducing travel distance between operations.
OSHA regulations require walking-working surfaces to be clean, orderly, and dry, with permanent aisles clearly marked. Yellow indicates caution and physical hazards. Floor organization isn't just a lean practice — it's a compliance baseline. That distinction matters when an auditor walks the floor.
Physical layout tools address:
- Pedestrian safety and traffic routing (OSHA-mandated aisle marking)
- Material flow sequencing through FIFO lane design
- Travel distance reduction via adjacent cell placement
- Department and hazard zone identification by color
Start here before anything else. Baseline order must exist before production performance data can be meaningfully displayed.
Labels, Shadow Boards & Markings
Shadow boards make missing tools impossible to overlook. Each tool has a physical outline cut to match its exact shape. When a tool is missing, the gap is visible from across the room without any inventory check. In precision machining environments, where every tool has a defined place and traceability matters, this simple mechanism prevents setups from starting with incomplete or wrong tooling.
Labeling systems extend this logic to:
- Bin labels with min/max inventory indicators
- Equipment tags and machine identification
- Hazard markings (OSHA-regulated, not optional)
- Color-coded areas by department or material type
Visual Work Instructions & SOPs
Posted work instructions built around photos, diagrams, and step-by-step graphics rather than text-heavy documents are the highest-impact visual tools for reducing production errors. The more visual the instruction, the less room for misinterpretation.
Digital work instructions push this further. Displayed on screens at workcenters rather than printed sheets, they can be updated centrally and pushed to every machine on the floor simultaneously. Operators always see the current revision, not whatever was printed last week.
This matters most in aerospace, defense, and precision machining environments where spec changes are frequent. AS9100D requires production instructions to be available at point of use and protected from unintended alteration. A shop running outdated paper SOPs isn't just inefficient — it's a compliance risk that shows up in audits and escapes.
Andon Systems & Real-Time Dashboards
LEI defines Andon as a visual management tool that highlights operational status and signals abnormalities the moment they occur: machine downtime, quality problems, tooling faults, material shortages. This is the centerpiece of visual factory management because it moves problem detection from end-of-shift review to real-time.
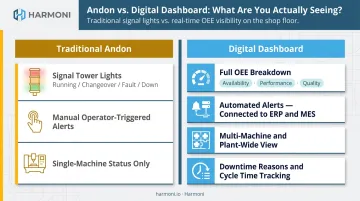
Traditional Andon systems use signal towers with colored lights: running, changeover, fault, or down. Digital production dashboards expand this into full KPI visibility across a single machine, a line, or the whole plant. That includes OEE (Availability × Performance × Quality), units produced vs. target, cycle times, downtime reasons, and quality pass/fail rates.
The critical distinction: passive dashboards display data; active platforms trigger alerts, connect to ERP and MES systems, and give information operational context. A screen showing a number is not the same as a system that tells you why that number changed.
Kanban boards (physical or digital) sit in this category as well, tracking job status through production stages and surfacing workflow bottlenecks visually.
Key Benefits of Visual Factory Management
Problems Surface While They're Happening
The core operational benefit is timing. When machine status, job progress, and quality metrics are visible in real time, supervisors can intervene while there's still something to save. An undetected quality issue caught after 200 parts means 200 parts of scrap. Caught after 5, it's a correctable setup problem.
According to Siemens' 2024 downtime analysis, a large automotive plant can lose $2.3 million per hour of unplanned downtime. Even for smaller operations, the cascading cost of undetected problems — scrap, rework, missed delivery commitments — compounds quickly.
Accountability Without Micromanagement
When the state of the operation is visible to everyone, operators don't wait for a supervisor to flag a problem — they can act on what they see. Supervisors spend less time communicating status and more time on decisions that actually require judgment.
McKinsey research found that frontline managers across industries spend 30–60% of their time on administrative work and meetings, plus 10–50% on non-managerial tasks. Visual tools that eliminate the need to gather and relay status information directly recover that time.
Faster Operator Onboarding
That same visibility advantage extends to new operators. Visual work instructions and clearly marked workstations get new hires up to speed faster by embedding the information they need directly in the workspace. When setup sheets, tolerances, and process steps are visible at the machine, operators aren't dependent on tribal knowledge to run the job correctly.
Key onboarding improvements visual tools drive:
- Reduces dependence on experienced operators to answer repeat questions
- Standardizes setup steps so new hires follow the same process as veterans
- Surfaces quality requirements at the point of work, not after inspection
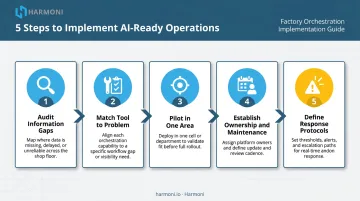
How to Implement Visual Factory Management
Step 1 — Audit Information Gaps
Walk the floor with a specific question in mind: where does information break down? Look for:
- Spots where operators stop to ask questions
- Locations where errors cluster
- Areas where supervisors spend the most time relaying status
These are the priority locations for visual tools. Fix the highest-friction points first.
Step 2 — Match Tool to Problem
Not every metric belongs on every board. The core principle: display only what operators and supervisors need to act on, and match the tool to the type of information.
| Information Type | Right Tool |
|---|---|
| Permanent spatial organization | Floor markings, lane tape |
| Tool location and accountability | Shadow boards |
| Machine run/fault status | Andon lights or signal towers |
| Production performance vs. target | Digital dashboard |
| Process guidance at the machine | Visual SOPs or digital work instructions |
Step 3 — Pilot in One Area First
Avoid overhauling the entire plant at once. Implement visual tools in one workcenter or production line, watch how operators use them, gather feedback, and refine before expanding.
Operators will identify gaps in your design that management can't see from the office. Involve them from the start.
Step 4 — Establish Ownership and Maintenance
A visual board is only useful when it reflects current reality. Assign ownership for updating physical boards, set review cadences for digital dashboards, and schedule regular audits to retire visuals that no longer serve a purpose. A stale board erodes trust in every visual tool on the floor. That makes it worse than having no board at all.
Step 5 — Define Response Protocols
Visual signals only change behavior if people know what to do when they see them. For every visual signal, define:
- Who responds
- What action to take
- Who escalates if the problem isn't resolved
Make these protocols as visual as the signals themselves. Post them at the board.
From Physical Tools to Digital Platforms: The Modern Visual Factory
The Limits of Static Visual Tools
Signs, whiteboards, and Andon lights are only as accurate as the person who last updated them. A whiteboard reflects the state of the shift when someone walked by and wrote on it. A posted metric chart is always at least a day behind. When processes change, floor tape and printed SOPs lag until someone physically replaces them.
The larger the operation — more lines, more shifts, multiple sites — the harder it becomes to keep physical visual tools synchronized with reality.
What Digital Platforms Add
Digital visual factory platforms close this gap by connecting directly to machines, ERP systems, and operator activity. Information flows automatically from the source to the display. No one has to update the board because the board updates itself.
Deloitte's 2025 Smart Manufacturing Survey found that 92% of manufacturing executives believe smart manufacturing will be their primary competitiveness driver over the next three years, and 88% expect smart-manufacturing spending to continue or increase. Digital visibility is no longer a pilot project — it's a strategic operating priority.
What to Look For in a Digital Visual Factory Platform
When evaluating platforms, prioritize these capabilities:
- Real-time machine data integration: pulls cycle times, run status, and fault codes directly from CNC equipment without manual input
- ERP connectivity: job routing, work orders, and costing data appear in the same view as machine output
- Operator-level visibility: tracks which operator is at which machine on which job, not just aggregate machine status
- Configurable alerts: problems surface as they happen, not in a post-shift report
- Bidirectional data flow: shop floor activity (labor, scrap, quality) writes back to the ERP automatically
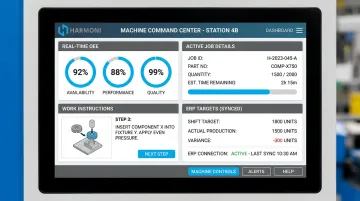
Where Harmoni Fits
Platforms that check all five boxes above look different in practice. Here's how Harmoni's factory orchestration platform delivers on each.
Harmoni sits between ERP systems, machines, and operators , combining all three data streams in real-time dashboards that reflect actual floor activity, not schedule assumptions.
A few specifics worth noting:
- RFID auto-detection reads employee badges and job travelers up to 15 feet away. When an operator approaches their machine, the system automatically identifies who they are and what job they're running, then loads the correct CNC program, surfaces the right work instructions, and starts time tracking without a single manual step.
- OEE indicator lights go beyond basic Andon. Green means the machine is producing at expected rates. Yellow means performance is slipping. Red means output is poor, including machines that are running but running slowly. These signals trigger automatically from machine performance data, not by an operator pressing a button.
- The machine-side command center gives operators access to work instructions, digital quality checksheets, job targets from the ERP, and shop communications from one touchscreen at their machine, eliminating trips to shared terminals.
- Bidirectional ERP integration with Epicor, Infor, JobBoss, ABAS, and ODOO means labor records, quantities, and scrap data post automatically , eliminating manual data entry and the reconciliation overhead that follows it.
Results from the field:
WessDel, a precision beryllium manufacturer, found operators were spending an average of 11 minutes per ERP transaction before Harmoni. After deployment, the shop gained 17 productive hours per employee per month and saw a 5X return on the platform's ongoing cost.
Machine Specialties, Inc., a high-precision aerospace and defense shop, nearly eliminated part count errors on complex, high-risk parts by connecting machine data with their Epicor ERP through Harmoni. Deployments typically complete in weeks, not months, with no machine replacement required.
Frequently Asked Questions
What are the examples of visual management tools?
The main categories cover several layers of the visibility problem:
- Floor markings and lane tape
- Shadow boards and Kaizen foam inserts
- Andon lights and signal towers
- Visual work instruction boards
- Production KPI dashboards and Kanban boards
- Digital real-time monitoring platforms
Each addresses a different layer — from spatial organization to live performance data.
What is the difference between a visual factory and visual management?
Visual factory management is the shop-floor-specific application of visual management principles, focused on production status, machine performance, job routing, and process control. Visual management is a broader methodology that applies to any workplace or business function — HR, finance, logistics — not just manufacturing operations.
How do digital visual factory platforms differ from traditional Andon boards and whiteboards?
Traditional tools require manual updates and only reflect the state at the last update. Digital platforms pull live data continuously from machines and systems, so the information is always current without human intervention. They also connect that data to ERP context, job details, and operator activity in a single unified view.
What metrics should be displayed on a visual factory dashboard?
The most actionable KPIs to display include:
- OEE (Availability, Performance, Quality)
- Units produced vs. target
- Current job and work order status
- Downtime reasons and duration
- Cycle time vs. standard and quality pass/fail rates
Role-specific views matter. Operators need job-level detail; managers need plant-wide performance trends.
How does visual factory management connect to lean manufacturing and 5S?
Visual factory management is a core lean practice. 5S uses visual tools to enforce workplace organization and make abnormalities immediately obvious. Andon systems support just-in-time production by surfacing problems at the moment they occur. Together, they cut the time spent on communicating status, tracking down information, and waiting on decisions.