Introduction
A precision machining shop wraps up a production run, only to discover that a dimensional tolerance drifted three hours ago. Hundreds of parts need rework. A defense subcontractor finds out a CNC machine failed mid-shift from a maintenance technician who happened to walk by — not from any alert or dashboard. These aren't edge cases. According to Siemens' 2024 True Cost of Downtime report, the average plant loses 27 hours per month across 25 separate downtime incidents — and in automotive, each idle production hour costs $2.3 million.
Real-time data analytics exists specifically to prevent these scenarios. This guide covers what it means in a smart manufacturing context, the technologies behind it, proven benefits, practical use cases, and how to build a realistic adoption roadmap — written for mid-to-large manufacturers in CNC machining, aerospace, automotive, and precision manufacturing.
Key Takeaways
- Plants lose an average of 27 hours per month to unplanned downtime — real-time analytics addresses this directly
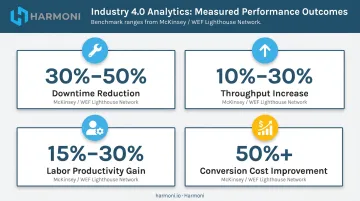
- Industry 4.0 analytics can reduce machine downtime 30%–50% and increase throughput 10%–30% (McKinsey)
- Analytics maturity progresses in stages: descriptive → diagnostic → predictive → prescriptive
- Legacy equipment doesn't need to be replaced — retrofit-based deployment gets existing machines producing data within weeks
- Labor visibility drives as much performance gain as machine monitoring — and most manufacturers haven't measured it yet
What Is Real-Time Data Analytics in Smart Manufacturing?
Beyond Batch Data Collection
Traditional manufacturing data collection is fundamentally reactive. Shops collect data in batches — end-of-shift logs, daily reports, weekly quality reviews — and by the time someone spots a problem, the damage is done:
- Defective parts are already produced
- Failed machines have already caused downtime
- Costs are already locked in
Real-time data analytics flips this model. It involves continuous collection of machine signals, operator activity, and process parameters through connected sensors and systems, analyzed instantly and surfaced in dashboards that operations leaders can act on while events are still unfolding.
NIST defines smart manufacturing as "fully-integrated, collaborative manufacturing systems that respond in real time" to changing factory, supply chain, and customer conditions. Real-time analytics is the intelligence layer that makes that responsiveness possible.
How It Differs from Standard Business Intelligence
Standard BI tools answer the question: what happened last month? Real-time manufacturing analytics answers: what is happening right now, and what should I do about it?
On a shop floor, that difference is the gap between catching a problem and absorbing it. A spindle running 15% below estimated speed silently erodes margin on a fixed-price aerospace contract. Historical reporting surfaces that at month-end review. Real-time analytics surfaces it during the shift, when intervention is still possible.
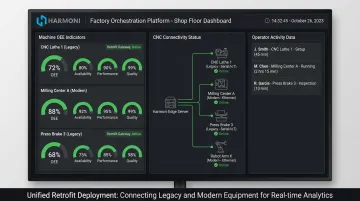
For platforms like Harmoni, this means combining live CNC spindle data, RFID-tracked labor records, and ERP job data into a unified view accessible from any device. When a machine's OEE indicator turns red, a supervisor can tap the terminal, identify the root cause, and call the work cell directly without leaving the office.
Key Benefits of Real-Time Analytics for Smart Manufacturing
Reduced Unplanned Downtime
Continuous monitoring of machine signals — cycle times, current draw, operational state — allows maintenance teams to catch anomalies before they become failures, shifting teams from reactive repair to proactive scheduling.
McKinsey research on Industry 4.0 implementations shows machine downtime can be reduced 30%–50% with connected analytics. A PwC survey of 280 manufacturers found predictive maintenance users achieved 9% average uptime improvement, 12% maintenance cost reduction, and a 14-month average payback period.
Higher Productivity and Throughput
Real-time visibility into bottlenecks, machine utilization, and work-in-progress status allows operations leaders to rebalance workloads mid-shift rather than discovering problems at shift-end review.
Measured outcomes from scaled implementations include:
- 10%–30% throughput increase and 15%–30% labor productivity gain (McKinsey Industry 4.0 data)
- 50%+ improvement in conversion costs, cycle times, and defect rates at WEF Global Lighthouse Network sites
Improved Quality Control and Scrap Reduction
Quality failures are expensive before they're even visible. According to IISE research, the cost of poor quality averages 15% of sales across manufacturers — ranging from 5% to 35%. Sensor-based in-line inspection can improve defect detection by 90% in discrete manufacturing environments (McKinsey, 2019).
Closed-loop quality systems catch non-conformances before parts advance down the line: real-time process data triggers alerts the moment tolerances begin to drift. Harmoni's digital checksheets let operators capture measurement data directly at the CNC terminal, with trend graphs showing when dimensions are drifting toward tolerance limits before scrap actually occurs.
Labor Visibility and Accountability
Tracking operator activity, job execution, and setup times in real time surfaces hidden inefficiencies that pure machine monitoring misses. An operator spending 11 minutes per shift manually entering ERP transactions at a shared terminal — as WessDel documented before implementing Harmoni — represents 17 productive hours lost per employee per month. Real-time labor data makes that waste visible and fixable.
Core Technologies Enabling Real-Time Manufacturing Analytics
IIoT Sensors and Machine Connectivity
Industrial IoT sensors stream live signals from equipment to edge or cloud-based systems. On a modern CNC machining center, this includes spindle data, machine state, cycle time, and operational status captured continuously, with no manual intervention required.
Connectivity methods vary by machine age and type:
- Modern machines: OPC UA, Ethernet, MTConnect
- Mid-generation machines: RS-232, FOCAS (Fanuc), proprietary protocols
- Legacy equipment: Analog inputs, current sensors monitoring power lines and indicator lights
Harmoni handles all three tiers. Its devices include built-in drivers for Mazak, Haas, Fanuc, Heidenhain, Siemens, DMG MORI, Makino, and Fadal - 57% use data analytics
- 46% use IIoT
- Only 29% use AI/ML at facility or network level
The infrastructure gap is widening: the tools exist, but connecting them into a unified analytics layer is where most manufacturers stall. That's precisely the problem ERP and MES integration is designed to solve.
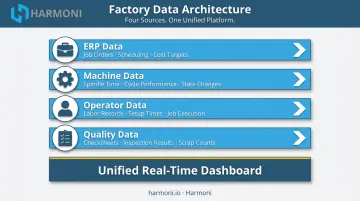
ERP, MES, and Factory Orchestration Integration
Machine-level data only tells part of the story. The most actionable analytics come from unifying data across systems, combining what machines report with what jobs require and what operators actually do.
This means connecting:
- ERP data: job orders, scheduling, cycle time estimates, cost targets
- Machine data: actual spindle time, cycle performance, state changes
- Operator data: labor records, setup times, job execution
- Quality data: checksheet inputs, inspection results, scrap counts
Harmoni's factory orchestration platform sits between these layers as the connective tissue. Rather than replacing existing ERP systems (Epicor, Infor, JobBoss, ABAS, ODOO), it integrates with them by pulling job data in, pushing labor records and production data back out, and surfacing the unified view in real-time dashboards.
Real-World Use Cases in Smart Manufacturing
Predictive Maintenance
A CNC machining center begins showing abnormal cycle time variance. On a traditionally monitored shop floor, this goes unnoticed until the spindle fails during a high-value production run. With real-time monitoring, the deviation triggers an alert. Maintenance schedules service during the next planned break, and the run completes on time.
PwC's predictive maintenance research found **60% of survey respondents saw measurable uptime improvement**, with average maintenance cost reductions of 12%. For a plant losing 27 hours per month to unplanned downtime, even a 30% improvement represents significant recovered capacity.
Quality Assurance and Scrap Prevention
In aerospace and defense manufacturing, a single non-conforming part can trigger a quality escape that halts deliveries and triggers customer audits. Real-time process monitoring creates an early-warning system:
- Cycle time deviations flag potential tool wear
- Dimensional measurement trends surface before tolerance violations
- Wrong-program protection ensures the correct CNC program runs for each part revision
Harmoni's closed-loop quality approach combines automated DNC program loading (preventing wrong-revision scrap at source), digital checksheets with real-time trend graphs, and exception alerts that notify managers before defective parts advance to the next operation. Machine Specialties, Inc. documented how this approach nearly eliminated part-count errors on complex, high-risk components.
Energy and Capacity Optimization
Linking energy meters to production data reveals which jobs or machines consume disproportionate energy per unit — enabling rescheduling of high-load operations to off-peak windows. The DOE reports organizations with energy management systems achieve 4% annual energy savings.
OEE tracking ties directly to capacity optimization. Typical OEE scores hover around 60%, while world-class is 85% (90% availability × 95% performance × 99.9% quality). For most shops, that 25-point gap is where recoverable production hours are hiding.
Real-time OEE dashboards consolidate availability, performance, and quality metrics across every workcenter — making those losses visible and actionable. McKinsey documents a factory transformation that targeted 10 percentage points of OEE improvement alongside over 30% product unit cost reduction, achieved by using data to prioritize exactly where capacity was being lost.
From Descriptive to Prescriptive: The Analytics Maturity Roadmap
Most manufacturers want to jump to predictive analytics. Few are ready. Progress is incremental, and real value is captured at every stage.
| Stage | Question Answered | What It Requires |
|---|---|---|
| Descriptive | What happened? | Structured data collection, accessible dashboards |
| Diagnostic | Why did it happen? | Correlated data across machines, operators, and processes |
| Predictive | What is likely to happen? | ML models, historical pattern data, anomaly detection |
| Prescriptive | What should we do? | AI-driven recommendation engines, closed-loop integration |
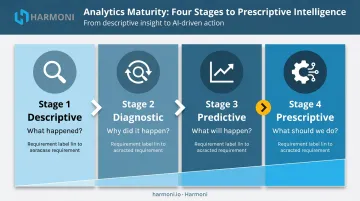
Stage 1: Descriptive
Most manufacturers already generate the raw data — the challenge is making it accessible. Structured dashboards surfacing real-time OEE, Visual Factory indicator lights, and shop floor views tied to ERP transactions turn raw machine output into something operators and managers can actually act on.
Stage 2: Diagnostic
Descriptive data tells you what happened. Diagnostic analytics tells you why. When a job runs 22% over estimate, the root cause could be the operator, the machine, the setup, or the CNC program. Answering that question requires pairing machine data with labor records and job parameters in a single correlated view — not three separate systems.
Stage 3: Predictive
This is where analytics generates measurable financial ROI at scale. ML algorithms flag early warning signs before failures or quality escapes reach the floor. Yet only 29% of AI/ML in manufacturing is deployed at the facility level today (Deloitte, 2025), meaning most shops have significant runway before they hit a ceiling here.
Stage 4: Prescriptive
Prescriptive analytics closes the loop — the system not only predicts a problem but recommends the optimal corrective action. Most manufacturers don't need to start here. Build data quality and organizational trust at Stage 1, move through diagnostic and predictive capabilities, and prescriptive intelligence becomes a natural next step rather than a leap of faith.
Overcoming Common Implementation Challenges
Legacy System Integration
Only 29% of manufacturers capture Industry 4.0 value at scale; the other 70% are stuck in "pilot purgatory" (McKinsey, 2019). The most common reason: legacy infrastructure without a realistic integration path.
The practical path forward is retrofitting, not replacement. Harmoni connects to existing CNC machines regardless of age or manufacturer, using terminal-based data capture, RFID integration, and protocol drivers that work alongside the machine's original control system. Supported controllers include Haas, Fanuc, Mazak, Siemens, Heidenhain, and DMG MORI. Deployment typically takes weeks.
Data Quality and Silos
Data scattered across machines, MES platforms, ERP systems, and spreadsheets — with inconsistent formats and no single source of truth — produces analytics that nobody trusts. Teams default to experience-based decisions instead of data-driven ones.
Key requirements for solving this:
- Normalized data models that translate machine-specific formats into consistent metrics
- Shared metric definitions that mean the same thing to every stakeholder — Harmoni's Part Cost Performance metric, for example, anchors performance to ERP-defined cycle time estimates, creating consistency across all machines
- Automated data capture that removes manual entry as a source of error and inconsistency
Skills Gaps and Change Management
Data quality problems are only half the equation. Even clean, reliable data fails to deliver value if shop floor teams don't know how to interpret or act on it. Deloitte's 2025 survey found 35% of manufacturing executives cite adapting workers to the "Factory of the Future" as a top concern.
Shops that have navigated this successfully tend to share a few practices:
- Dashboards designed for operator-level interpretability, not data scientists (color-coded OEE lights over complex charts)
- Training framed around empowerment, not surveillance — data helps operators catch problems before they become their problem
- Starting with high-visibility wins that build confidence in the data before expanding scope
Frequently Asked Questions
What is the difference between real-time analytics and traditional manufacturing data collection?
Traditional data collection is batch-based: logs are reviewed after shifts or production runs, meaning problems surface after costs are already incurred. Real-time analytics captures and surfaces data as events unfold, enabling intervention while a process deviation is still correctable.
How does real-time analytics help reduce unplanned downtime in manufacturing?
Continuous monitoring of machine state, cycle performance, and operational signals enables predictive maintenance , flagging anomalies before failure occurs. Service can then be scheduled during planned downtime windows rather than responding reactively to unexpected stoppages.
What technologies are required to implement real-time analytics on the shop floor?
Core components include: IIoT sensors or machine connectivity hardware; edge or cloud computing infrastructure; an integration layer connecting machines to ERP and MES systems; and analytics dashboards or a factory orchestration platform like Harmoni that surfaces actionable insights to operators and managers.
How long does it take to implement a real-time analytics system in manufacturing?
Phased approaches (starting with high-value assets and existing data sources) can deliver measurable results in weeks rather than months. Harmoni's retrofit architecture is specifically designed for rapid deployment, with no machine replacement or infrastructure overhaul required.
What is OEE and why does it matter in smart manufacturing analytics?
Overall Equipment Effectiveness is a composite metric of Availability, Performance, and Quality. World-class OEE is 85%; most manufacturers operate around 60%. Real-time OEE tracking pinpoints exactly where capacity is being lost across each workcenter and provides the data to prioritize improvements with the highest impact.
How does real-time analytics integrate with existing ERP and MES systems?
Integration is typically achieved through a factory orchestration layer that normalizes data from machines, operator activity, and enterprise systems into a unified view. ERP job data, machine telemetry, and labor records flow together without requiring replacement of existing infrastructure.