Introduction
Most manufacturers sitting on years of ERP data still run their shops off gut instinct. Production planners work from stale reports. Supervisors discover schedule variances at end-of-shift. Job cost reports come back wrong because labor was entered hours after the fact — if it was entered at all.
The data exists. It just never reaches the shop floor in time to change what happens today.
According to Rockwell Automation's 2026 State of Smart Manufacturing report, only 43% of collected manufacturing data is used effectively — and 37% of manufacturers cite disconnected or non-integrated data as a major internal obstacle to growth. That gap between data collected and data acted on is where operational performance actually gets lost.
This article covers how ERP-driven analytics closes that gap — across production planning, labor visibility, job costing, and quality control — and how leading manufacturers are turning their ERP from a passive record system into an active driver of shop floor decisions.
Key Takeaways
- Only 43% of collected manufacturing data is used effectively, leaving most ERP analytics potential untapped
- ERP analytics spans five maturity levels; most manufacturers only use the first two
- Accurate job costing requires automated data capture, not manual entry after the fact
- A factory orchestration layer connects ERP records to real-time shop floor execution
- Start with two or three focused use cases before scaling to predictive analytics
Why ERP Is the Data Backbone of Modern Manufacturing
No other system in a manufacturing operation touches as many functions as the ERP. Production orders, labor records, inventory movements, procurement, job costs, financials — it's all captured in one place. Unlike point solutions that capture a slice of the operation, ERP data already spans the full value chain.
The problem isn't what the ERP holds. It's how manufacturers use it.
From System of Record to Analytics Engine
Most ERPs are used as systems of record — they capture what happened. A purchase order was issued. A job was completed. Hours were logged. That's valuable, but it's backward-looking by design.
The shift to treating ERP as an analytics engine means deliberately connecting that data to workflows that inform what to do next — not just what happened last week.
This requires moving through five levels of manufacturing analytics:
| Level | Type | Question Answered |
|---|---|---|
| 1 | Descriptive | What happened? |
| 2 | Diagnostic | Why did it happen? |
| 3 | Predictive | What will happen? |
| 4 | Prescriptive | What should we do? |
| 5 | Prognostic | How will systems behave over time? |
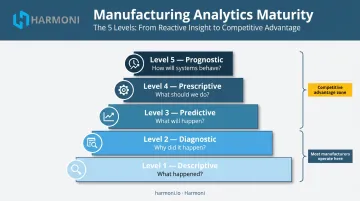
Most manufacturers operate at levels one and two. The payoff from levels three through five — demand forecasting, maintenance prediction, yield optimization — is where the competitive gap opens up.
The Data Silo Problem
Advancing through those higher analytics levels requires clean, connected data. That's exactly what silos prevent. Before integrated ERP, production teams ran off whiteboards, finance pulled from separate systems, and quality lived in a binder somewhere.
That fragmentation hasn't fully disappeared. Rockwell's 2023 survey of 1,353 global manufacturers found that about one-third of collected data still goes unused and 79% lacked end-to-end supply chain planning software. The silos are smaller now, but they're still there, and they still cost decisions.
More dashboards bolted onto the outside of the ERP won't solve this. Closing the gap means connecting what the ERP records to what's actually happening on the floor, in real time.
Key Manufacturing Operations That ERP Analytics Can Optimize
ERP-driven analytics doesn't improve everything at once. The highest-impact areas are production scheduling, labor and job costing, and inventory management — and each requires a different kind of data connection.
Production Planning and Schedule Adherence
Traditional production scheduling is a one-way process: planners create orders, push them to the floor, and find out how things went at end of shift. By then, the opportunity to course-correct has passed.
ERP analytics enables a closed loop instead:
- Pull production orders from ERP with estimated cycle times and planned quantities
- Track actual execution against those orders in real time
- Feed actual performance data back into updated planning rates
- Recalibrate future schedules based on what the floor can actually deliver
The difference between guesswork-based scheduling and data-driven rates shows up fast. Real-time order tracking against ERP schedules gives supervisors the visibility to intervene mid-shift — reassigning work, adjusting priorities, or flagging a machine that's running behind — rather than discovering the variance during end-of-day review.
Labor Visibility and True Job Costing
This is where ERP data quality problems hit hardest. Traditional job costing relies on operators manually entering time after the fact — setup time is estimated, machine downtime goes unrecorded, and the result is job cost reports that are systematically off.
Whether jobs end up under- or over-costed often depends on which data gets forgotten.
True job costing looks different when ERP data is tied to actual operator and machine activity:
- Estimated vs. actual cost per job — visible at the job level, not just in aggregate
- Work centers that consistently run over budget — identifiable by pattern, not anecdote
- Setup and downtime costs — captured and allocated, not absorbed as overhead
- Quoting accuracy — grounded in real performance data, not historical averages
When labor time is captured automatically at the machine and synced to ERP job records in real time, cost reports reflect what actually happened. That changes pricing conversations, capacity decisions, and profitability analysis.
Inventory and Supply Chain Optimization
ERP analytics gives supply chain managers a live view of inventory levels, consumption rates, and supplier lead times. The shift from periodic reorder cycles to demand-driven procurement reduces both stockouts and excess carrying costs.
Those pressures are significant: Rockwell's 2026 survey found that 30% of manufacturers cite raw material volatility as a top external obstacle, and 28% cite supply chain disruption. ERP analytics doesn't eliminate those pressures. It replaces reactive firefighting with forward-looking visibility, shifting procurement decisions from weekly batch reviews to continuous, data-driven adjustments.
Closing the Loop: Connecting ERP Analytics to Real-Time Shop Floor Execution
Here's the core execution gap most manufacturers don't fully acknowledge: ERP systems record what was planned and what was reported. They rarely capture what is actually happening on the shop floor right now.
Operators don't log into ERP immediately. Machine data doesn't automatically flow to job records. Setup time, interruptions, and rework are invisible until someone enters them — which often happens hours later, if at all. This means ERP analytics is always working from yesterday's version of reality — and the gap between reported and actual creates the conditions for poor decisions.
The Factory Orchestration Layer
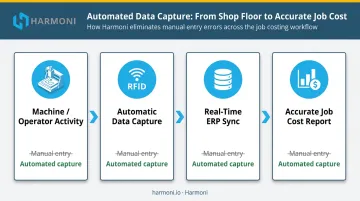
The mechanism for closing this gap is a factory orchestration layer — software that sits between ERP systems, machines, and operators to coordinate the execution of work and automatically feed real data back into ERP records.
Rather than waiting for operators to manually update job status, a factory orchestration layer:
- Captures machine cycle data automatically from CNC controls
- Tracks operator activity at each work center via RFID identification
- Syncs actual labor minutes, machine states, and production counts back to ERP job records in real time
The result: ERP job cost reports reflect actual labor time, not estimates. OEE dashboards reflect real machine states, not manually logged downtime. Production variance reports show what actually happened, not what operators remembered to enter at the end of shift.
Platforms like Harmoni operate as this orchestration layer — combining machine data, operator activity, and ERP workflows to bring real-time visibility to the shop floor through unified dashboards. Harmoni integrates natively with major manufacturing ERPs including Epicor, Infor, Infor Visual, ECI JobBoss/JobBoss2, ABAS, and ODOO, connecting shop floor execution directly to the ERP data that drives analytics decisions.
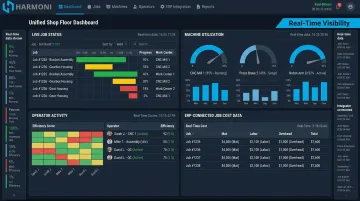
Real-Time KPI Dashboards
When ERP data and shop floor execution data are merged, supervisors stop waiting for reports. A unified dashboard shows:
- Live job status — which orders are on track, which are running behind
- Machine utilization — current OEE by work center, not yesterday's average
- Operator productivity — actual performance against ERP-estimated cycle times
- Schedule adherence — real-time view of how the shift is tracking against plan
Problems become visible as they're happening, not after production is complete. Supervisors can redirect labor, adjust priorities, or flag quality concerns mid-shift — before the damage is done.
ERP, MES, and Factory Orchestration: How They Relate
These three layers serve distinct functions:
- ERP — handles planning, job costing, inventory, and business-level data
- MES — tracks production execution: work orders, routings, work-in-process
- Factory orchestration — coordinates the people, machines, and systems that make execution happen correctly, and feeds that real-time data back through both ERP and MES layers
The orchestration layer doesn't replace ERP or MES. It makes both of them more accurate by ensuring the data flowing into them reflects what's actually happening on the floor.
Predictive Maintenance and Quality Control Through ERP Analytics
Predictive Maintenance
Unplanned downtime is expensive by any measure. Siemens/Senseye's 2022 research found that Fortune Global 500 industrial companies lose nearly $1.5 trillion annually to unplanned downtime — equal to 11% of yearly turnover. The average large plant suffers 20 downtime incidents per month.
ERP analytics, combined with machine performance data, shifts maintenance from reactive to predictive. Instead of responding to failures, manufacturers can identify early warning patterns that signal a machine needs attention:
- Degrading cycle times on specific work centers
- Increasing error rates or out-of-tolerance outputs
- Rising downtime frequency on individual machines
Scheduling maintenance during planned slow periods costs a fraction of what an unplanned stoppage costs.
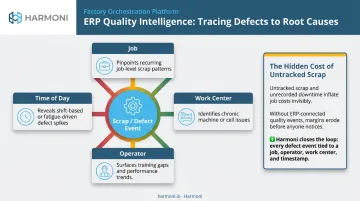
Quality Analytics
ERP-driven quality analytics reveals defect patterns tied to specific jobs, work centers, operators, or time periods. That's the difference between knowing you have a scrap problem and knowing exactly where it originates.
Without ERP integration, quality data and production data live in separate places. Root cause analysis becomes a manual exercise of cross-referencing spreadsheets. With integration, quality trends are visible in context — linked to the job, the machine, the operator, and the time of day.
This connects directly to job costing. Unplanned downtime and scrap are the hidden costs that turn profitable-looking jobs into money-losers. Making those costs visible and traceable — rather than absorbing them into overhead — is what gives job cost data its real teeth.
Common Challenges in Leveraging ERP Data for Manufacturing Analytics
Three barriers show up consistently when manufacturers try to activate their ERP data:
1. Data quality Analytics are only as accurate as the data feeding them. According to the Manufacturing Leadership Council, 70% of manufacturers still collect data manually. If labor time is entered hours after the fact, or machine downtime isn't captured at all, job cost reports and OEE dashboards will be systematically misleading.
The fix is automating data capture at the source — eliminating manual entry entirely, rather than just training operators to enter data more carefully.
2. Integration complexity Older ERP systems weren't built to connect easily with shop floor machines or modern analytics tools. Custom integrations take time and maintenance. Platforms designed to bridge this gap — like Harmoni, which retrofits to existing equipment regardless of age or manufacturer and connects to ERPs through native integrations — reduce this complexity without requiring machine replacement.
3. Organizational resistance When supervisors and operators are accustomed to spreadsheets and tribal knowledge, dashboards can feel like surveillance rather than tools. Getting buy-in means starting with simplified interfaces that connect data to day-to-day decisions — and securing early wins that build credibility before asking teams to change long-standing habits.
Address data quality first. Sophisticated dashboards built on inaccurate inputs will consistently mislead — and erode trust in the entire analytics initiative.
Steps to Building an Analytics-Ready Manufacturing Operation
Step 1 — Define the Use Cases That Matter Most
Before investing in tools or integrations, identify two or three operational problems that data could actually solve. Inaccurate job costing. Poor schedule adherence. High scrap rates on a specific work center. Specific problems drive specific data requirements — and early wins build the internal credibility that funds the next phase.
Step 2 — Audit and Automate Data Capture at the Source
Map every point in your operation where ERP data is manually entered or estimated rather than automatically captured. Those are the gaps in your analytics foundation. Prioritize automating those inputs:
- Machine connectivity — direct CNC control integration for cycle time and machine state data
- RFID-based labor tracking — automatic operator clock-in/out and job identification at the work center
- Machine-side operator interfaces — quality data, production counts, and job status entered at the machine, not at a shared terminal
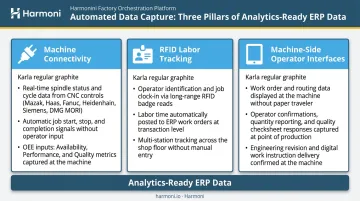
The quality of ERP analytics depends entirely on the quality of the data flowing in.
Step 3 — Start with Operational Dashboards, Then Layer in Predictive Analytics
With clean data flowing in, the next priority is visibility. Live job status, machine utilization, and labor tracking dashboards give teams something concrete to act on — and build confidence in the data itself.
Once teams are consistently using those dashboards to make decisions, predictive analytics becomes the logical next layer:
- Demand forecasting — anticipate capacity needs before they become scheduling problems
- Maintenance prediction — act on machine performance trends before unplanned downtime hits
- Quality trend analysis — catch drift in a work center before scrap rates climb
Predictive models require historical depth and careful development. Trying to skip straight to prediction without a solid operational data layer produces unreliable outputs — and erodes trust in the entire analytics program.
Frequently Asked Questions
What types of analytics does an ERP system support in manufacturing?
ERP can support all five levels: descriptive (what happened), diagnostic (why it happened), predictive (what will happen), prescriptive (what to do), and prognostic (how systems will behave over time). Most manufacturers currently use only descriptive and diagnostic analytics, leaving the most valuable optimization capabilities untapped.
How does ERP data analytics help reduce production errors and scrap?
ERP analytics surfaces quality patterns tied to specific jobs, operators, machines, or time periods. When those patterns are linked to actual production conditions rather than isolated in a spreadsheet, root cause analysis is faster and corrective actions can be targeted before defects compound.
What is the difference between ERP analytics and MES analytics in manufacturing?
ERP analytics focuses on business-level data: job costs, schedules, inventory, and financials. MES analytics focuses on production execution: cycle times, machine states, and operator activities. The most actionable insights come when both layers are integrated, combining ERP's planning context with MES's execution data.
How can manufacturers improve job costing accuracy with ERP data?
Accuracy improves when actual labor time, machine cycle data, and material consumption are automatically captured and synced to ERP job records in real time. Manual entry after the fact consistently introduces gaps that skew cost reports and undermine quoting accuracy.
What KPIs should manufacturers track using ERP-driven analytics?
The highest-value KPIs for most discrete manufacturers include:
- OEE (availability, performance, and quality)
- Schedule adherence
- Estimated vs. actual job cost variance
- Scrap and defect rate by work center
- Inventory turnover and labor utilization by work center
How long does it take to see results from ERP analytics in a manufacturing operation?
Manufacturers who start with focused use cases and automate data capture at the source typically see measurable improvements within weeks of deployment. Deeper predictive analytics, such as demand forecasting and maintenance prediction, mature over a few months as historical data accumulates.